


 74 / 302

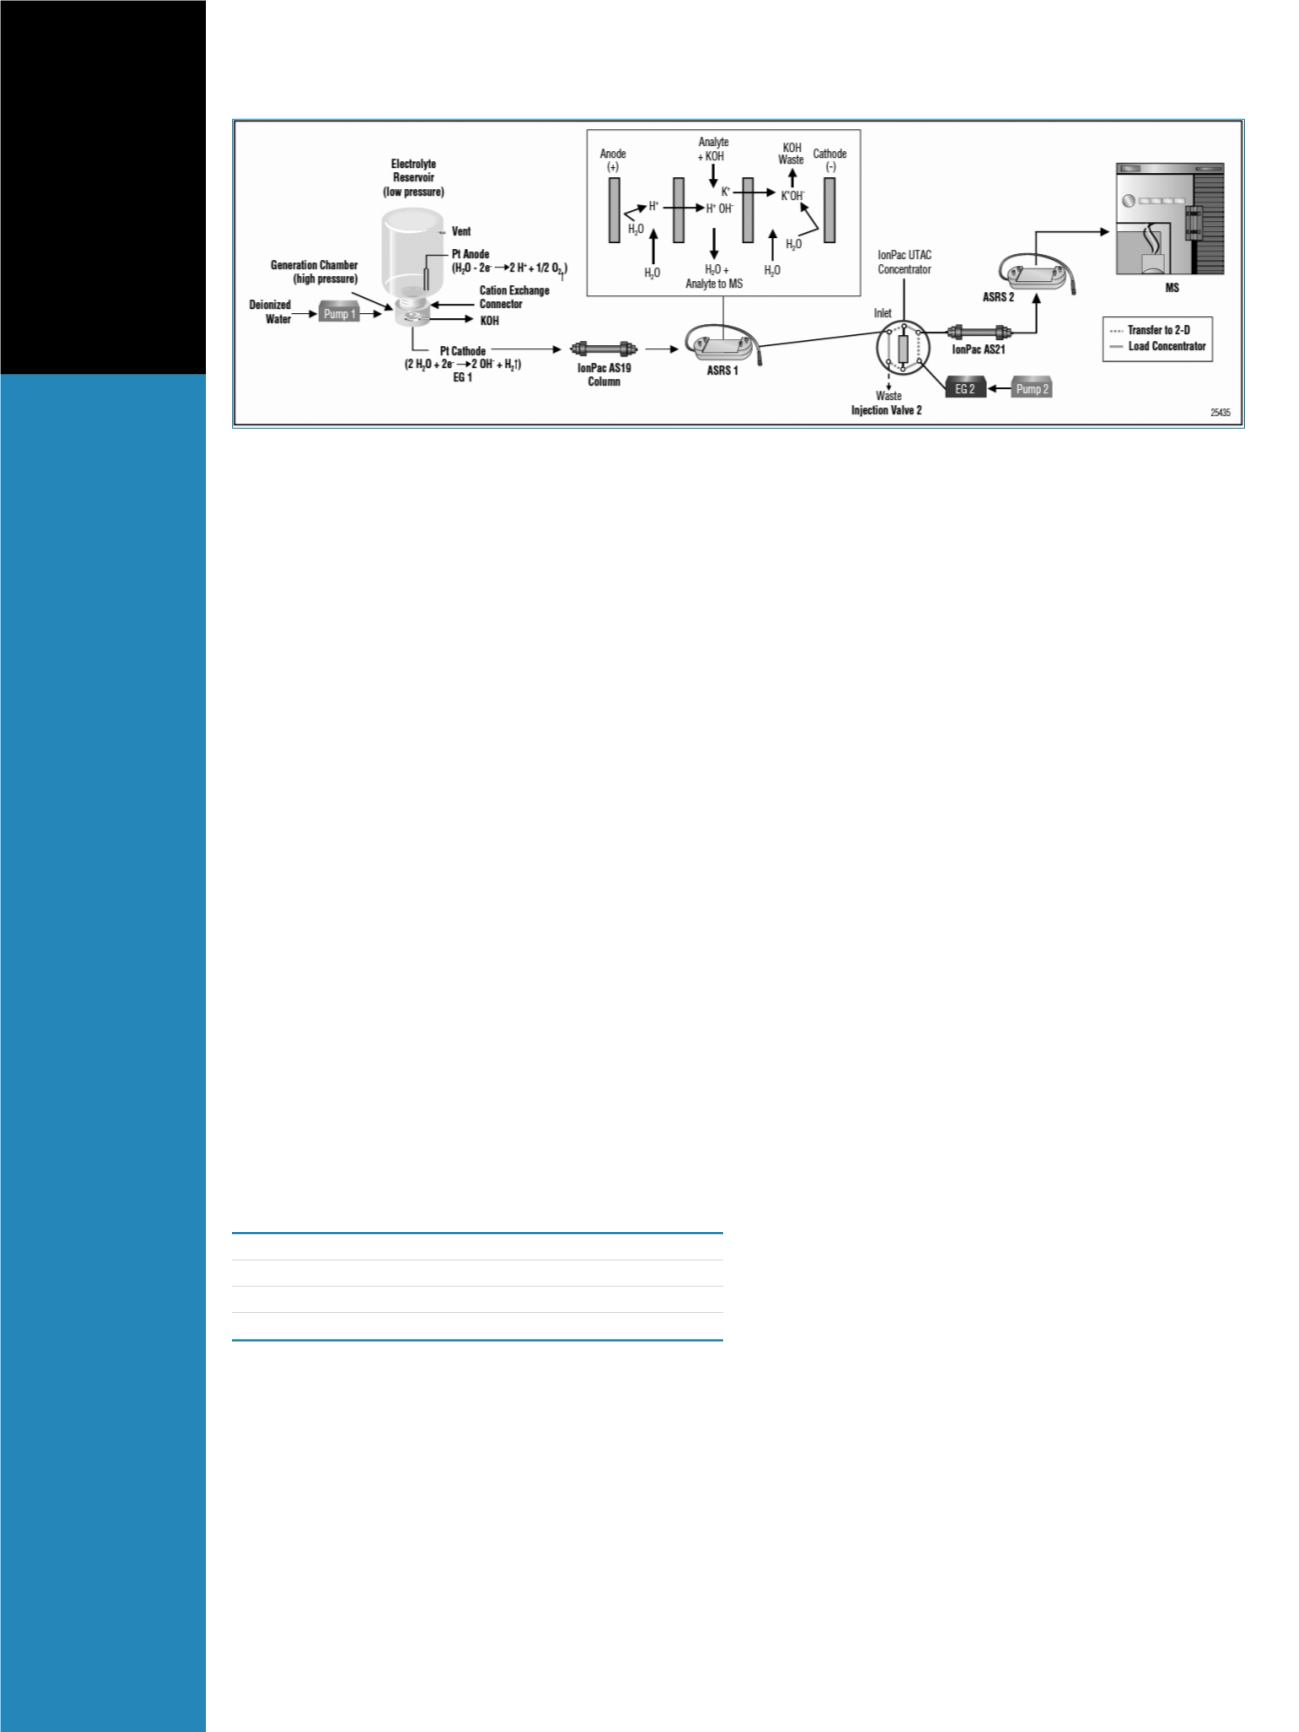
The high-purity IC eluent is automatically produced in
situ (Figure 1). The pump delivers water to an eluent
generator cartridge (EGC) that converts the water into the
selected concentration of potassium hydroxide eluent
using electrolysis. After separation on the column, the
eluent enters the anion self-regenerating suppressor
(ASRS) that produces hydronium ions to exchange with
potassium in the eluent. This makes the mobile phase
compatible with the mass spectrometer liquid inlet system.
Mass Spectrometry
MS analysis was carried out on a Thermo Scientific TSQ
Quantum Access triple stage quadrupole mass
spectrometer with an electrospray ionization (ESI) source.
The MS conditions were as follows:
Ion source polarity:
Negative ion mode
Spray voltage:
3000 V
Sheath gas pressure:
40 arbitrary units
Ion sweep gas pressure: 1 arbitrary unit
Auxiliary gas pressure: 2 arbitrary units
Capillary temperature: 400 °C
Collision gas pressure: 1.5 bar
Scan conditions:
Table 1
Table 1. MS Scan Conditions
Scan
Scan
Collision
Tube
Compound
Mass
Width Time (s)
Energy
Lens
AMPA
110.17 / 63.3
0.01
0.5
19
60
AMPA
110.17 / 79.2
0.01
0.5
35
60
Glyphosate
168.09 / 150.1
0.01
0.5
13
51
Glyphosate
168.09 / 79.4
0.01
0.5
40
51
Results and Discussion
The major matrix peaks of chloride, nitrate, carbonate,
and sulfate were well-resolved. The separation of all
compounds occurred in both dimensions in 30 minutes.
The calibration curves showed excellent linearity using
only external quantitative measurements without internal
standards.
For quantitation, samples were run in the MS/MS
selective reaction monitoring (SRM) mode on the TSQ
Quantum Access
™
triple stage quadrupole instrument. The
calibration range was 0.1–50 ppb for AMPA and
0.05–50 ppb for glyphosate. The correlation coefficients
(R
2
) of the 110
→
63 and 110
→
79 SRM transitions of
AMPA were both 0.9997 (Figures 2 and 3). The 168
→
150 transition of glyphosate had an R
2
of 0.9997 and the
168
→
79 transition yielded an R
2
of 0.996 (Figures 4 and
5, respectively).
The minimum detection limit (MDL) in matrix was
calculated by seven replicate injections of 5 ppb in a
simulated matrix with high concentrations of chloride,
carbonate, nitrate, and sulfate (250 ppm chloride and
sulfate, 150 ppm sodium bicarbonate, 20 ppm nitrate).
The MDLs for AMPA and glyphosate were calculated by
using the equation MDL=
t
99%
× S
(n-1)
, where
t
equals the
Student’s
t
test at 99% confidence intervals (
t
99%, (6)
=
3.143) and S is the standard deviation. The calculated
MDL for AMPA was 0.313 ppb and 0.252 ppb for
glyphosate. This is well below the current MDLs of 6 ppb
for glyphosate in reagent water and 8.99 ppb in ground
water specified by the EPA guidelines found in Method
547.
Using ion chromatography to quantitate AMPA and
glyphosate accurately at this level without sample
pretreatment requires the use of a mass spectrometer.
However, the source of the instrument can be subject to
fouling from routine analysis of samples of high-ionic
strength. The use of multi-dimensional chromatography
significantly reduces the introduction of matrix ions to the
mass spectrometer, increasing the method robustness in
challenging sample matrices. The recoveries for AMPA
and glyphosate were 97.2% and 82.1%, respectively, for
5 ppb spiked into high-ionic strength samples. The relative
standard deviations were less than 5% for both
compounds, even without an internal standard (Figure 6).
Figure 1. The flow schematic for a two-dimensional IC-MS/MS application. The first dimension separates the analytes of interest from a majority of the
matrix ions. The second dimension improves peak shape and keeps the source of the MS clean.