 
          
            Sample Preparation


          To prepare the samples, a 10 mL sample of wine was
        
        
          saturated with NaCl. The sample was placed in a vial and
        
        
          extracted using SPME. A PDMS/DVB 65 µm StableFlex
        
        
          ™
        
        
          SPME Fiber (SUPELCO-57293U) was used, and the fiber
        
        
          was exposed to the sample for agitation for 30 minutes at
        
        
          70 °C at three-second intervals.


            Instrumental Analysis


          The ISQ mass spectrometer used for this analysis was set to
        
        
          perform sequential full scan/SIM acquisitions. The TRACE
        
        
          ™
        
        
          GC Ultra was equipped with a standard split/splitless injector.
        
        
          The split/splitless injector temperature was set to 220 °C, and
        
        
          a splitless injection was used. The ISQ GC-MS parameters
        
        
          are summarized in Table 2. The analytical column used
        
        
          was a Thermo Scientific TraceGOLD TG-5MS 15 m
        
        
          ×
        
        
          0.25 mm i.d.
        
        
          ×
        
        
          0.25 µm film (PN 26098-1300). TCA d5 was
        
        
          used as an internal standard; its SIM ions are 215 and 217.
        
        
          The results were analyzed using Thermo Scientific
        
        
          QuanLab Forms software. QuanLab
        
        
          ™
        
        
          Forms automatically
        
        
          tests the expected retention times (RT), actual ratio versus
        
        
          range of tolerance, and the coelution of ions. QuanLab Forms
        
        
          is also Directorate-General for Health and Consumer
        
        
          Protection (SANCO) compliant and can be used in
        
        
          the European Union.
        
        
          Results
        
        
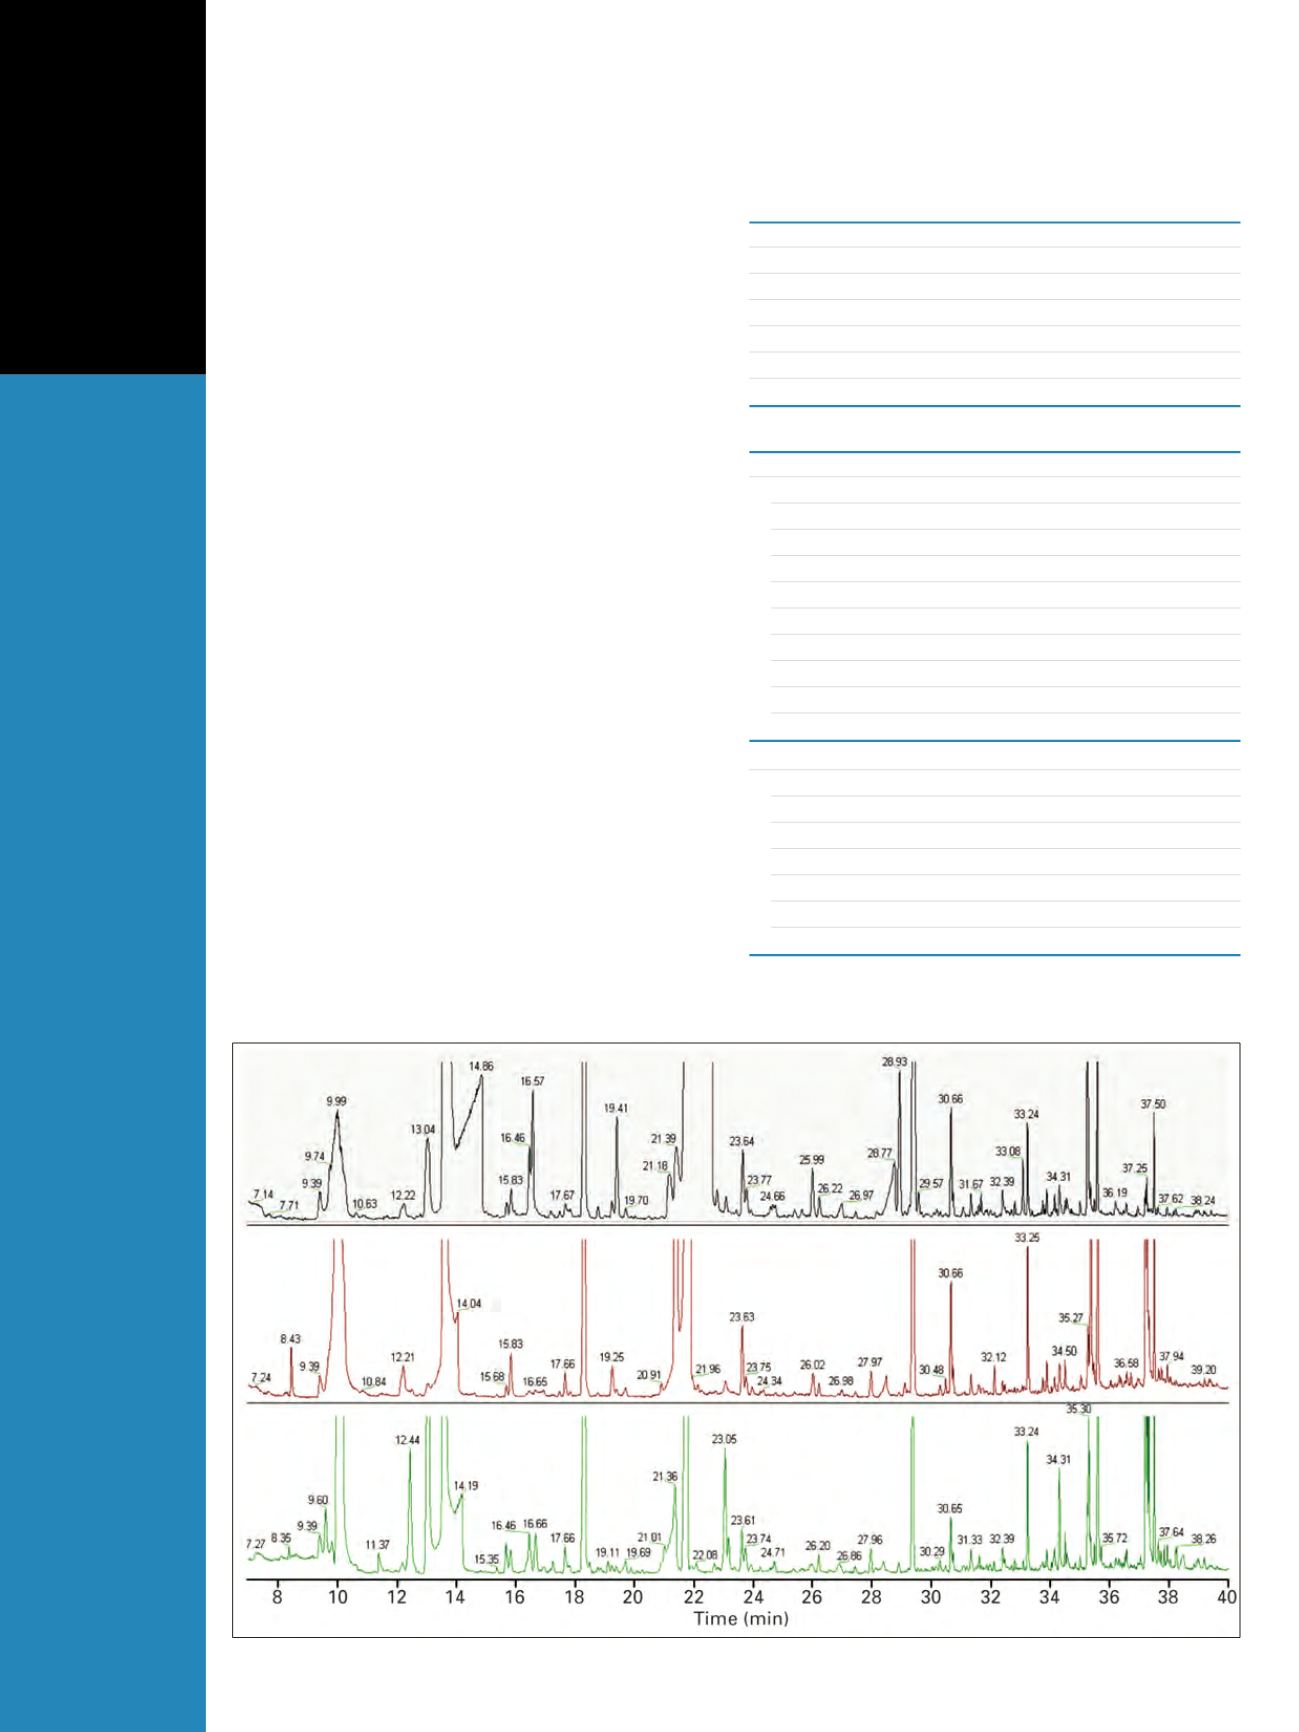
          The spectra of the sequential SIM scan can be seen in
        
        
          Figure 2. The SIM ions monitored using the ISQ are listed
        
        
          in Table 3. Figures 3 through 7 present the calibration curves
        
        
          of several of the target molecules at various linearity ranges.
        
        
          Calibration ranges were established according to the range
        
        
          of human perception – and to the range of interest for
        
        
          oenologists – as opposed to instrument performance.
        
        
          For all these target molecules, the GC-MS was able to detect
        
        
          lower concentrations than the limits of human perception.
        
        
          Figure 2: Chromatograms showing full-scan acquisitions for three wine types


            ISQ


          Source Temp (°C)
        
        
          200
        
        
          Detector Gain
        
        
          1
        
        
          ×
        
        
          10
        
        
          5
        
        
          Start Time (min)
        
        
          0.2
        
        
          Acquisition End Time (min)
        
        
          40
        
        
          Full Scan Range (u)
        
        
          35–450
        
        
          Dwell Time (ms)
        
        
          20
        
        
          SIM Ions
        
        
          See Table 3


            TRACE GC Ultra


          Oven Method
        
        
          Initial Temp (°C)
        
        
          40
        
        
          Initial Time (min)
        
        
          1.0
        
        
          Rate #1 (°C/min)
        
        
          5
        
        
          Initial Temp #2 (°C)
        
        
          60
        
        
          Initial Time #2 (min)
        
        
          1
        
        
          Rate #2 (°C/min)
        
        
          3
        
        
          Initial Temp #3 (°C)
        
        
          125
        
        
          Hold Time #3 (min)
        
        
          1
        
        
          Rate #3 (°C/min)
        
        
          10
        
        
          Final Temp (°C)
        
        
          238
        
        
          SSL Method
        
        
          Splitless
        
        
          Temperature (°C)
        
        
          220
        
        
          Mode
        
        
          Splitless
        
        
          Splitless Time
        
        
          3 min
        
        
          Carrier Flow (mL/min)
        
        
          1.2
        
        
          Gas Saver
        
        
          On
        
        
          Vacuum Compensation
        
        
          On
        
        
          Transfer Line (°C)
        
        
          250
        
        
          Table 2: Instrument method summary for the full scan/SIM analysis of target
        
        
          molecules on the ISQ and TRACE GC Ultra


            White


            Rosé 2010


            Red 2007