
3
Thermo Scienti c Poster Note
•
PN ASMS13_T351_MLopez_E 07/13S
Results
Intelligent Data Acquisition
Initial discovery experiments were performed to help drive targeted quantitative
experiments (Figures 1, 2). The discovery experiments were performed in an unbiased
data-dependent acquisition across different biological samples to determine proteins
and peptides as well as the initial set of PTMs. From the initial discovery results,
histones and histone modification proteins were chosen and further targeted discovery
experiments were performed to increase the probability of modified peptide
identification based on theoretical
m/z
inclusion lists. The combined results from the
discovery experiments were used to build a local spectral library consisting of
precursor and product ion
m/z
values and relative abundance distribution as well as
relative retention time values. A set of peptides from the discovery data was selected
based on known and novel PTMs. The spectral library information for the targeted
peptides was used to create a targeted inclusion list and reference information to
perform qual/quan determination in real time. The real-time feedback facilitated
optimization of instrument parameters to maximize instrument duty cycle and detection
capabilities resulting in significantly increasing the number of peptides quantified per
experiment. The final assay performed qual/quan studies on 36 proteins and 154
histone and histone-related peptides and modified analogs (Table 1). The combined
approach enabled quantification of previously identified modified peptides as well as
novel targets across different samples and were correlated to somatic or stem cell
aging (replicative or genotoxic stress-induced senescence) (Figs 3-5).
isition strategy for HR/AM global
histone modification enzymes
human adipose tissue and
hermo Scientific™
cquisition method.
on 36 proteins and 154 histone
e combined approach enabled
as well as novel targets across
em cell aging (replicative or
ost all known nuclear
ications dictate the different
additional chromatin structural
ontain six nucleosomes per
cleosomes per 11 nm. A
chromatin compaction states is
anization (nuclear architecture),
Functional differences between
ors and epigenetic programs,
grity of the cellular phenotypes
romatin is anything but static.
ich must occur during DNA
influence the state of chromatin
sophila, yeast, and plants
the onset of DNA double-strand
pen question how to quantify
o such is through cellular
rations in buffer solutions, three
r soluble (proteins that are
(containing tightly bound
ns). Tracing histones or
dynamics in these fractions
erall chromatin dynamics and
chromatin composition in
d during drug-evoked
“access, repair, restore” model
a better understanding of
ritical factors of cellular
onditions: 1) Acute DNA
damage-induced cellular
mycin treatment). Both
(self-renewing) cells.
HR/AM MS, we have developed
analysis of histones, histone
odification enzymes.
ipose tissue and treated with
atin fraction samples were
s cells under conditions of acute
escence (bleomycin 2 hrs
meter. Initial discovery
des/protein IDs and
was selected for targeted
led analogs were used for
e data analysis was performed
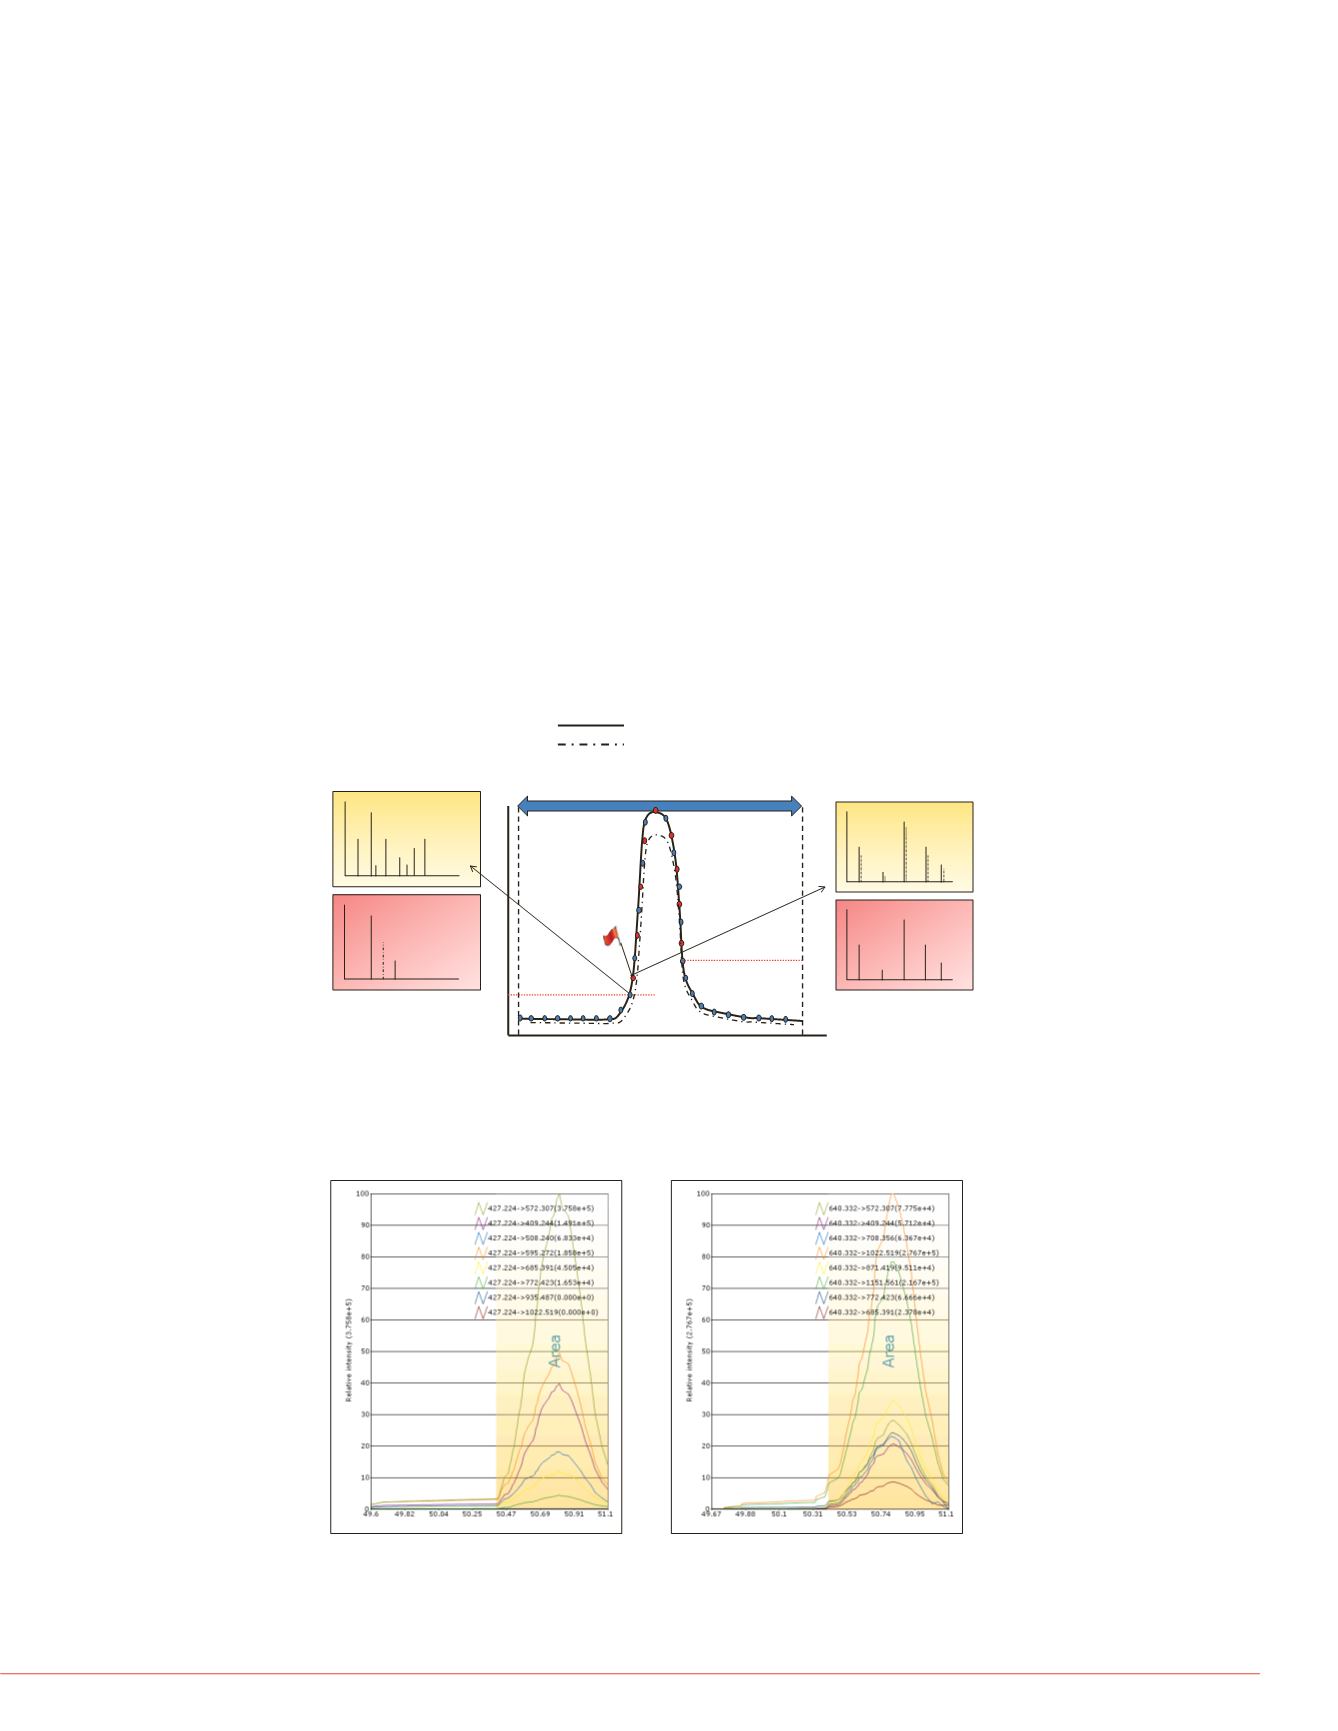
FIGURE 1. Intelligent data acquisition strategy. Pictorial representation of
intelligent data acquisition schemes for targeted peptide quantification using
a targeted scanning window, target elution identification, and real-time
product ion spectral acquisition. Both precursor and product ion spectral
matching are performed to increase the selectivity of data acquisition.
TABLE 1. Targeted proteins and
Theoretical
Isotope
Experimental
HR/AM MS
Spectrum
*
*
Measured Ion Intensity
RetentionTime (min)
Start time for “watch list”
Stop time for “watch list”
Triggering
Threshold
1.
Spectral
Library
Experimental
Spectrum
Proteins
>tr|H0Y765|H0Y765_HUMANHistone-lysineN-methyltransferaseMLL3 (Fragment)OS=Homo sapiensGN=MLL3PE=2SV=
>sp|P07305|H10_HUMANHistoneH1.0OS=Homo sapiensGN=H1F0PE=1SV=3
>tr|Q5TEC6|Q5TEC6_HUMANHistone cluster2 H3 pseudogene2OS=Homo sapiensGN=HIST2H3PS2PE=1SV=1
>sp|Q92769|HDAC2_HUMANHistonedeacetylase2OS=Homo sapiensGN=HDAC2PE=1SV=2
>sp|Q86X55|CARM1_HUMANHistone-argininemethyltransferaseCARM1OS=Homo sapiensGN=CARM1PE=1SV=3
>sp|Q9UQL6|HDAC5_HUMANHistonedeacetylase5OS=Homo sapiensGN=HDAC5PE=1SV=2
>sp|P68431|H31_HUMANHistoneH3.1OS=Homo sapiensGN=HIST1H3APE=1SV=2
>sp|P33778|H2B1B_HUMANHistoneH2B type1-BOS=Homo sapiensGN=HIST1H2BBPE=1SV=2
>sp|Q96A08|H2B1A_HUMANHistoneH2B type1-AOS=Homo sapiensGN=HIST1H2BAPE=1SV=3
>sp|P62807|H2B1C_HUMANHistoneH2B type1-C/E/F/G/IOS=Homo sapiensGN=HIST1H2BCPE=1SV=4
>sp|Q93079|H2B1H_HUMANHistoneH2B type1-HOS=Homo sapiensGN=HIST1H2BHPE=1SV=3
>sp|Q8IUE6|H2A2B_HUMANHistoneH2A type2-BOS=Homo sapiensGN=HIST2H2ABPE=1SV=3
>sp|P16402|H13_HUMANHistoneH1.3OS=Homo sapiensGN=HIST1H1DPE=1SV=2
>sp|Q9NQW5|PRDM7_HUMANProbablehistone-lysineN-methyltransferasePRDM7OS=Homo sapiensGN=PRDM7PE=
>sp|P16403|H12_HUMANHistoneH1.2OS=Homo sapiensGN=HIST1H1CPE=1SV=2
>sp|Q02539|H11_HUMANHistoneH1.1OS=Homo sapiensGN=HIST1H1APE=1SV=3
>sp|P56524|HDAC4_HUMANHistonedeacetylase4OS=Homo sapiensGN=HDAC4PE=1SV=3
>sp|O14686|MLL2_HUMANHistone-lysineN-methyltransferaseMLL2OS=Homo sapiensGN=MLL2PE=1SV=2
>tr|Q8TC04|Q8TC04_HUMANKeratin23 (Histonedeacetylase inducible)OS=Homo sapiensGN=KRT23PE=2SV=1
>tr|Q6FHM6|Q6FHM6_HUMANNHP2non-histone chromosomeprotein2-like1 (S. cerevisiae)OS=Homo sapiensGN=N
>sp|Q09472|EP300_HUMANHistoneacetyltransferasep300OS=Homo sapiensGN=EP300PE=1SV=2
>sp|Q6DN03|H2B2C_HUMANPutativehistoneH2B type2-COS=Homo sapiensGN=HIST2H2BCPE=5SV=3
>sp|Q92522|H1X_HUMANHistoneH1xOS=Homo sapiensGN=H1FXPE=1SV=1
>sp|P62805|H4_HUMANHistoneH4OS=Homo sapiensGN=HIST1H4APE=1SV=2
>sp|Q09028|RBBP4_HUMANHistone-bindingproteinRBBP4OS=Homo sapiensGN=RBBP4PE=1SV=3
>sp|P20671|H2A1D_HUMANHistoneH2A type1-DOS=Homo sapiensGN=HIST1H2ADPE=1SV=2
>sp|P04908|H2A1B_HUMANHistoneH2A type1-B/EOS=Homo sapiensGN=HIST1H2ABPE=1SV=2
>sp|P16401|H15_HUMANHistoneH1.5OS=Homo sapiensGN=HIST1H1BPE=1SV=3
>sp|Q13547|HDAC1_HUMANHistonedeacetylase1OS=Homo sapiensGN=HDAC1PE=1SV=1
>sp|Q8TEK3|DOT1L_HUMANHistone-lysineN-methyltransferase H3 lysine-79specificOS=Homo sapiensGN=DOT1LPE
>sp|Q96QV6|H2A1A_HUMANHistoneH2A type1-AOS=Homo sapiensGN=HIST1H2AAPE=1SV=3
>sp|Q71UI9|H2AV_HUMANHistoneH2A.VOS=Homo sapiensGN=H2AFVPE=1SV=3
>sp|O75367|H2AY_HUMANCorehistonemacro-H2A.1OS=Homo sapiensGN=H2AFYPE=1SV=4
>sp|Q9P0M6|H2AW_HUMANCorehistonemacro-H2A.2OS=Homo sapiensGN=H2AFY2PE=1SV=3
>sp|Q16695|H31T_HUMANHistoneH3.1tOS=Homo sapiensGN=HIST3H3PE=1SV=3
>sp|P10412|H14_HUMANHistoneH1.4OS=Homo sapiensGN=HIST1H1EPE=1SV=2
FIGURE 2. Extracted ion chromatograms of fragment ions from KESYSIYVKYK
A. Precursor ion charge state 3
B. Precursor ion charge state 2
Most intense isotope
2
nd
most intense isotope


