
5
Thermo Scienti c Poster Note
•
PN63785_E 03/13S
Conclusion
A large number of compounds, with lo
a new LC/MS/MS platform demonstra
compounds of interest to clinical rese
The Prelude SPLC Systemʼs lower vo
shorter. The reduced run time results
phases and less waste disposal.
The Prelude SPLC uses a single syri
dampeners, reduces the mechanical
active check valves, and does not ne
maintenance, reducing operating cost
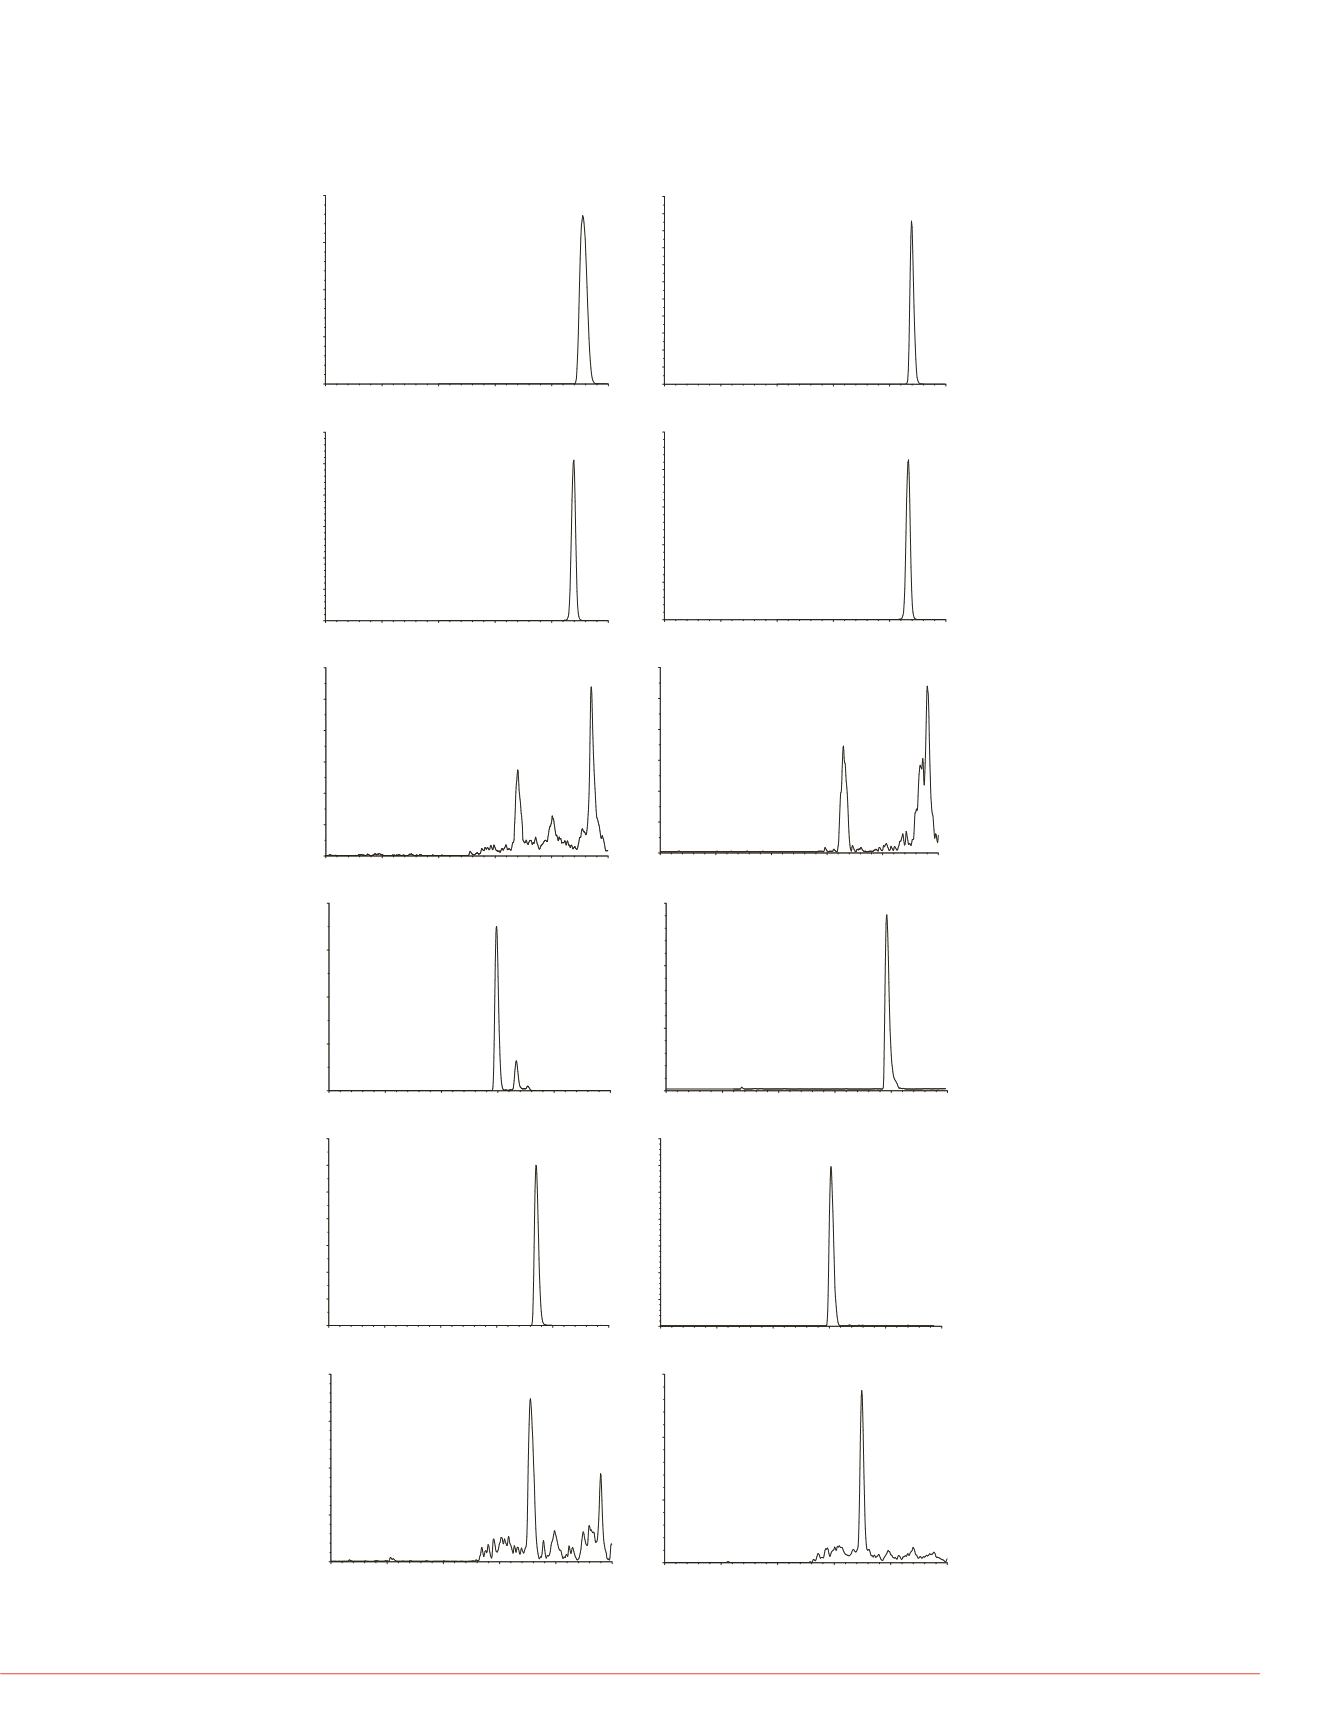
FIGURE 2. Representative Chromatograms at the LOQ for Each Compound
Tested Using a Prelude SLPC
TM
LC/MS/MS System
d Using a Prelude SLPC
TM
0.5
1.0
1.5
2.0
2.5
3.0
0
5000
10000
15000
20000
Busulfan
Time (min)
Intensity (mv)
0.5
1.0
1.5
2.0
2.5
3.0
0
50
100
150
200
250
300
Cortisol
Time (min)
Intensity (mv)
0.5
1.0
1.5
2.0
2.5
3.0
0
2000
4000
6000
8000
10000
12000
14000
Imatinib
Time (min)
Intensity (mv)
0.5
1.0
1.5
2.0
2.5
3.0
0
50
100
150
200
250
300
350
Methotrexate
Time (min)
Intensity (mv)
0.5
1.0
1.5
2.0
2.5
3.0
0
200
400
600
800
25-Hydroxy Vitamin D2
Time (min)
Intensity (mv)
0.5
1.0
1.5
2.0
2.5
3.0
0
1000
2000
3000
25-Hydroxy Vitamin D3
Time (min)
Intensity (mv)
0.5
1.0
1.5
2.0
2.5
3.0
0
100
200
300
400
500
600
Testosterone
Time (min)
Intensity (mv)
0.5
1.0
1.5
2.0
2.5
3.0
0
500
1000
1500
2000
Cyclosporin A
Time (min)
Intensity (mv)
0.5
1.0
1.5
2.0
2.5
3.0
0
200
400
600
800
1000
1200
1400
1600
1800
2000
2200
Sirolimus
Time (min)
Intensity (mv)
0.5
1.0
1.5
2.0
2.5
3.0
0
500
1000
1500
2000
2500
3000
Tacrolimus
Time (min)
Intensity (mv)
0.5
1.0
1.5
2.0
2.5
3.0
0
500
1000
1500
2000
2500
Everolimus
Time (min)
Intensity (mv)
specificity criterion. Recoveries, including
data is summarized in Tables 1 to 3. Figur
compound tested. Representative chroma
each compound are shown in Figure 2.
The improvement in run times resultin
System verses a conventional HPLC is illu
phases and columns were used for the co
of certain steps cannot be changed becau
separation needed. The duration of others
for solvent changes to reach the column.
dependent on the chromatography and; th
However, the transfer, column cleaning an
conventional HPLC the transfer step was
column clean-up and equilibration steps w
reduction in run time of 29% (5:15 minute
solvent consumption by 33%.
FIGURE 3. Comparison of the Metho
SLPC LC/MS/MS System to that of a
0
50
100
Prelude SPLC
Conventional HPLC
Sample
Clean-up
Sample
Clean-up
Sample
Transfer
Sample
Transfer
S
20
30
40
50
Sirolimus
Concentration (ng/mL)
20
30
40
50
Tacrolimus
Concentration (ng/mL)
150
200
250
300
350
400
Cortisol
Concentration (ng/mL)
300
400
500
600
700
Methotrexate
Concentration (ng/mL)
40
60
80
100
-Hydroxy Vitamin D3
Concentration (ng/mL)
0.5
1.0
1.5
2.0
2.5
3.0
0
1000
2000
3000
Docetaxel
Time (min)
Intensity (mv)
400
600
800
1000
Docetaxel
Concentration (ng/mL)


