


 170 / 302

4
Quantitative Analysis
The high scan speeds and fast analytical cycle time of the
Velos Pro mass spectrometer enabled higher numbers of
analytical scans across chromatographic peaks for optimal
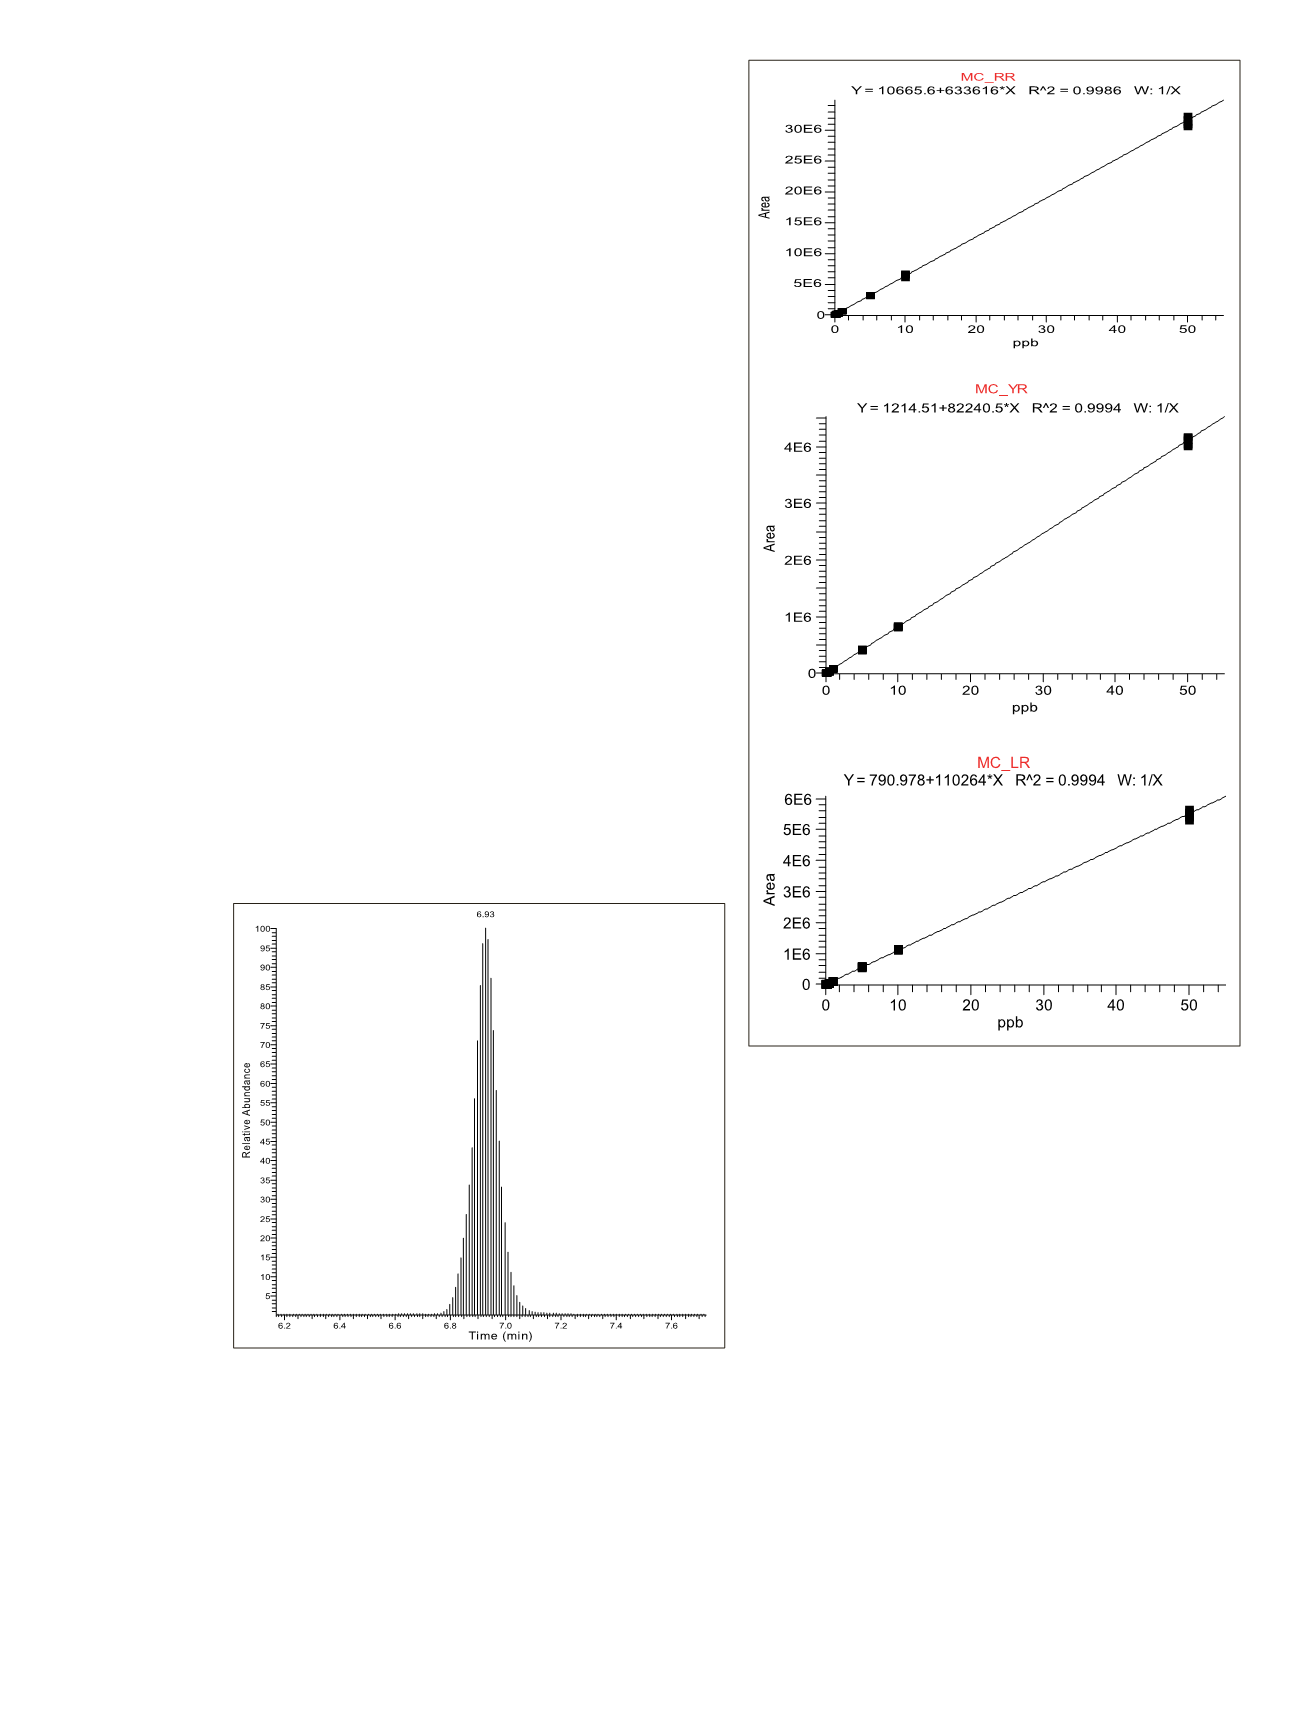
quantitative reliability (Figure 3). Excellent linearity in
detector response was observed over the range of
0.05-50 µg/L for all three microcystins. Calibration curves
for MC-RR, MC-YR and MC-LR are shown in Figure 4,
with coefficients of determination of 0.9986, 0.9994, and
0.9994, respectively. The lowest detectable amount (LOD)
of 0.025 µg/L and quantifiable amount (LOQ) of 0.05 µg/L
were achieved for each microcystin. Both QC samples, at
levels of 0.5 and 5 µg/L, achieved quantitation accuracy
better than 94% for all three microcystins. Signal-to-noise
ratios of >25 with automatic ICIS algorithm integration in
Thermo Scientific Xcalibur software were obtained for
MC-LR at the LOQ (Figure 5), demonstrating that this
LC-MS/MS method can be used to determine MC-LR at
concentrations well below the WHO’s recommended
guideline level of 1 µg/L.
Method reproducibility was investigated by analyzing five
replicate injections of each analyte. Peak area RSDs for
MC-LR and MC-YR were less than 7% and 11%,
respectively, over the entire linear dynamic range (Table 2).
For MC-RR, peak area RSDs over the range 0.10-50 µg/L
were under 6%; at the LOQ, the peak area RSD was 16%
(Table 2). Retention time precisions were 0.3% RSD or
less over the entire dynamic range (Figure 6) for all three
microcystins. Tap water, filtered water and surface pond
water were analyzed using this method. No microcystins
were in any of the three water sources.
Figure 3. High scan speeds and fast cycle times enable more than
20 data points to be acquired across the MC-LR chromatographic
peak.
Figure 4. Calibration curves for quantitation of MC-RR, MC-YR
and MC-LR