


 146 / 302

6
Table 5. Calculated concentrations of TCDD/F congeners in soil and sediment samples run on both GC-MS/MS and GC-HRMS. (ND=not detected)
Soil
Sediment 1
Sediment 2
SETOC 738 (CRM
GC-MS/MS
ng/kg
GC-HRMS
ng/kg
GC-MS/MS
ng/kg
GC-HRMS
ng/kg
GC-MS/MS
ng/kg
GC-HRMS
ng/kg
GC-MS/MS
ng/kg
GC-HRMS
ng/kg
2,3,7,8 TCDF
0.992
1.23
16.0
10.4
2.15
1.51
17.9
17.1
2,3,7,8 TCDD
ND
ND
1.85
2.29
2.03
5.10
23.1
23.9
1,2,3,7,8 PeCDF
1.26
<1.79
25.4
25.4
4.90
4.52
7.36
6.76
2,3,4,7, 8 PeCDF
1.57
1.96
41.5
44.2
10.7
9.29
47.8
45.4
1,2,3,7,8, PeCDD
0.436
ND
5.49
5.71
9.14
7.95
7.26
6.91
1,2,3,4,7,8,-HxCDF
1.89
1.89
56.1
57.3
64.8
71.9
43.8
45.1
1,2,3,6,7,8,-HxCDF
1.81
2.14
64.8
55.0
223
197
15.1
14.7
2,3,4,6,7,8,-HxCDF
2.53
2.83
86.9
91.5
9.47
11.5
20.2
18.4
1,2,3,4,7,8,-HxCDD 0.271
ND
5.38
6.34
15.0
10.9
10.4
8.62
1,2,3,6,7,8,-HxCDD 0.382
0.905
8.33
8.58
17.6
16.7
28.1
20.1
1,2,3,7,8,9-HxCDD
0.469
ND
6.62
6.97
17.5
14.0
21.4
22.4
1,2,3,7,8,9-HxCDF
0.932
ND
25.8
31.4
15.2
13.4
4.65
5.40
1,2,3,4,6,7,8-HpCDF
12.9
14.2
464
473
5.05
4.58
214
202
1,2,3,4,6,7,8-HpCDD 4.80
5.78
63.4
62.2
18.3
16.6
416
433
1,2,3,4,7,8,9-HpCDF
1.90
3.07
48.8
48.8
68.3
54.4
15.1
15.4
OCDD
24.7
23.8
153
191
6.38
5.38
3020
3030
OCDF
258
291
475
554
47.7
39.5
290
316
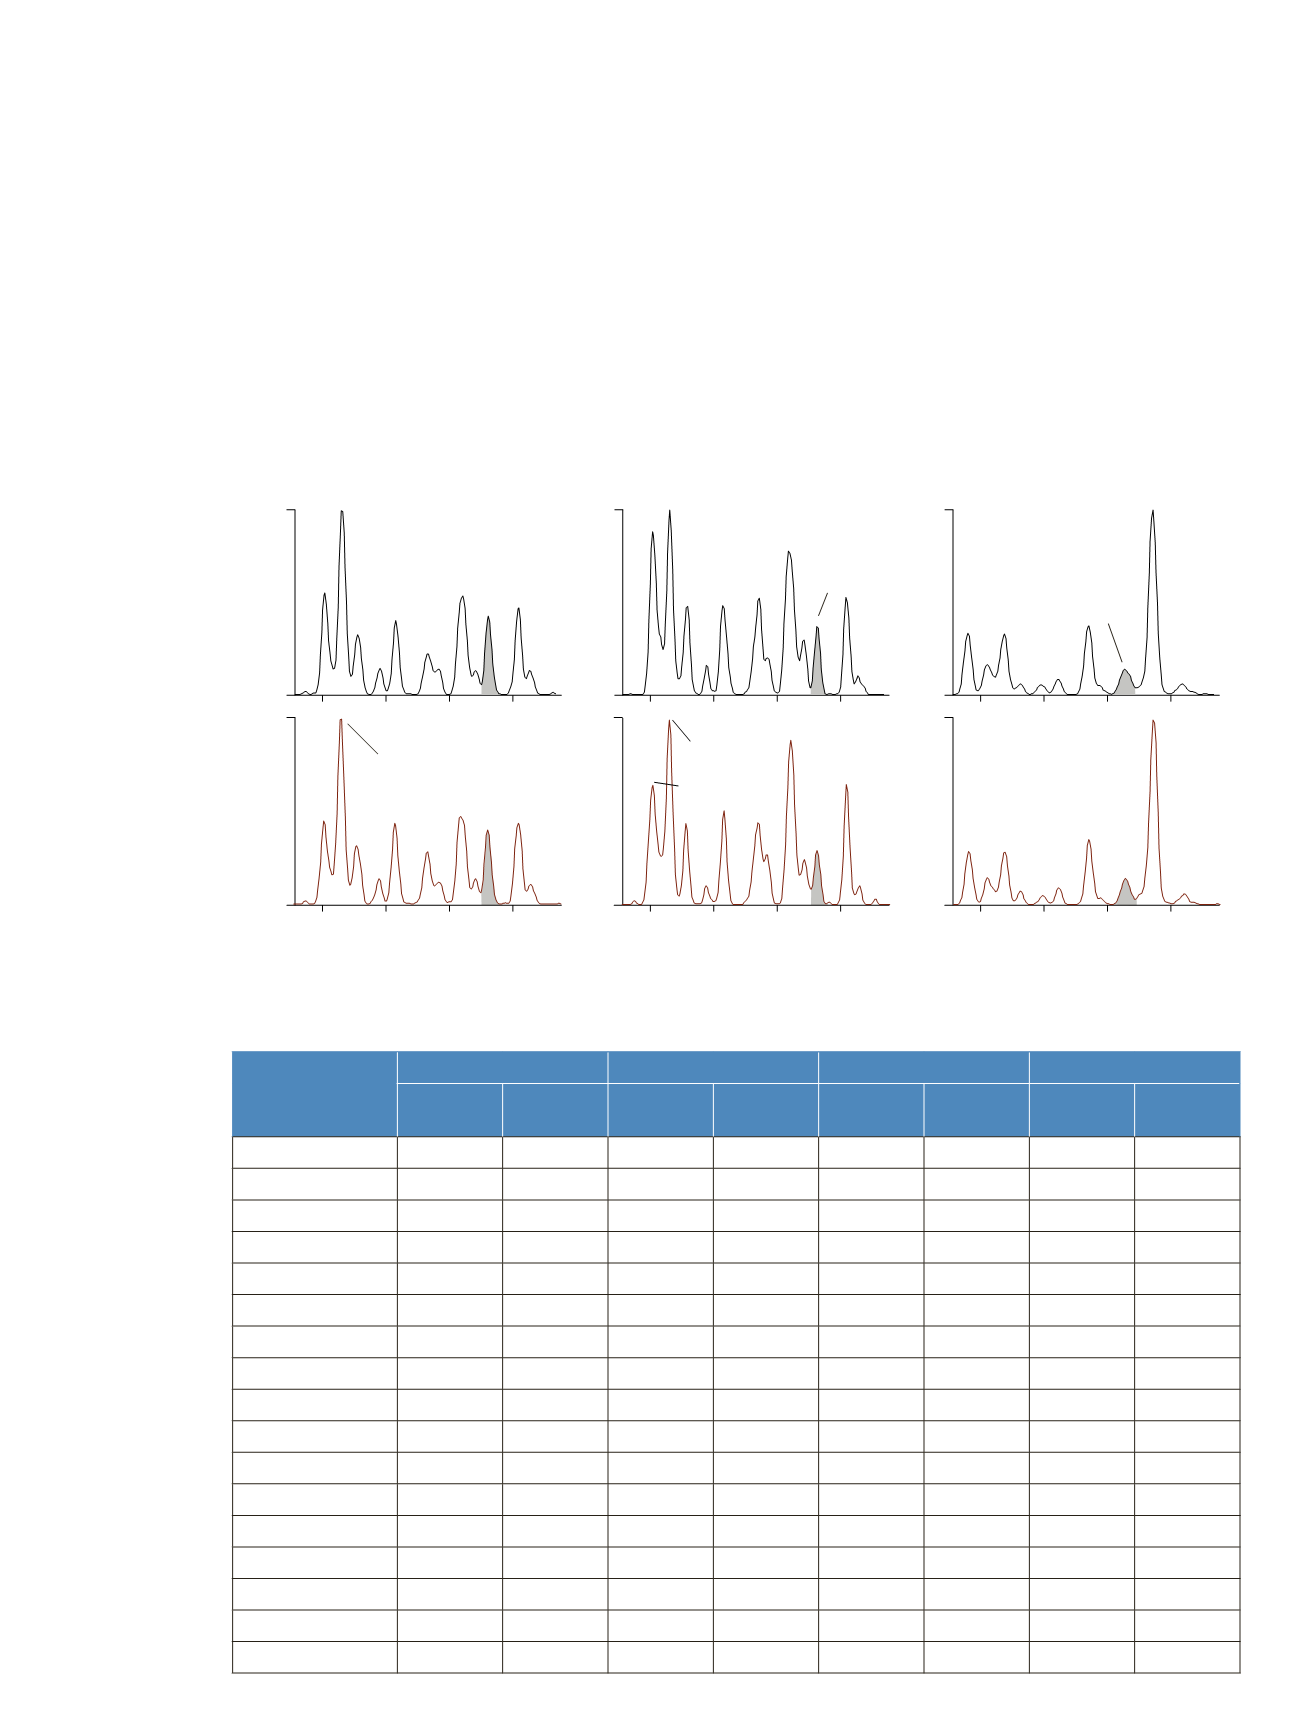
Figure 4. TCDD SRM chromatograms for three different sample types typically analyzed in the environmental laboratory.
Left: Fly ash (2,3,7,8-TCDD 31.4 ng/kg), Center: Contaminated soil (2,3,7,8-TCDD 1.85 ng/kg), Right: Contaminated sediment (2,3,7,8-TCDD 17.9 ng/kg).
Routine Samples
The QC performance was reflected in the real sample
batches with generally very good agreement in results
between the GC-MS/MS and GC-HRMS approach.
Larger deviations in calculated value were reported for
incinerator fly ash samples, particularly for the lower
chlorinated PCDFs. These differences are thought to arise
from selectivity differences in the two techniques. The
GC-MS/MS result remained valid within the quality
control criteria specified within the methodology. SRM
chromatograms for TCDDs in three different routine
environmental sample types are given in Figure 4. These
include both quantifying and confirming SRM transitions.
The selective detection of the highly significant 2,3,7,8-
TCDD congener was achievable in all samples.
Calculated concentrations for each congener are given in
Table 5 for both the GC-MS/MS and GC-HRMS analyses
for routine soil, sediment, and a matrix QC sample. Again,
these show a good level of agreement in the calculated
result. For the soil samples, the TSQ Quantum XLS Ultra
showed confirmed detections of PCDD/Fs for the low
concentration samples when no result was reported from
GC-HRMS. This was due to the lower performance of the
GC-HRMS system used in this study and not directly
related the more sensitive systems available today.
Relative Abundance
Relative Abundance
Minutes
Minutes
Minutes
100
0
100
0
32.0
32.5
33.0
33.5
32.0
32.5
33.0
33.5
32.0
32.5
33.0
33.5
321.89 > 258.93
321.89 > 258.93
321.89 > 258.93
Fly Ash
Contaminated Soil
Contaminated Sediment
319.90 > 256.93
319.90 > 256.93
319.90 > 256.93
2,3,7,8-TCDD
RT: 33.31
2,3,7,8-TCDD
RT: 33.31
2,3,7,8-TCDD
RT: 33.31
32.02
33.09
RT: 32.16
RT: 33.31
RT: 32.02
RT: 32.15
RT: 33.11
RT:33.11
RT: 33.54
RT:33.11
RT: 33.36