
4
Therapeutic Drug Monitoring of 9 New Anticancer Agents by High-Performance Liquid Chromatography-Tandem Mass Spectrometry
Product
ion
TL/CE
Product
ion
CE
Ion
Ratio
226.0
192/-18
208.0
-28
60
401.0
184/-29
231.9
-38
40
277.9
136/-21
336.0
-22
40
394.1
170/-25
222.0
-27
20
394.1
170/-25
349.9
185/-36
364.9
-38
75
288.9
199/-29
261.0
-42
45
251.9
176/-31
270.0
-21
75
282.9
134/-28
326.0
-20
60
83.1
142/-32
111.9
-64
15
Analyte
Slope
Intercept
R
2
BORT
Mean
CV
0.000179
14.8
0.0000483
142.9
0.9935
0.48
DASA
Mean
CV
0.000989
9.3
-0.0004033
181.7
0.9967
0.26
ERLO
Mean
CV
0.00820
7.1
0.2222
40.8
0.9913
0.46
IMAT
Mean
CV
0.0198
5.4
-0.009083
137.8
0.9980
0.10
LAPA
Mean
CV
0.000286
11.5
-0.0004005
164
0.9964
0.22
NILO
Mean
CV
0.002519
3.88
-0.02377
91.8
0.9911
1.44
SORA
Mean
CV
0.000657
10.8
-0.020596
24.0
0.9894
0.69
SUNI
Mean
CV
0.00514
6.9
0.00121
183.9
0.9919
0.46
VAND
Mean
CV
0.0000199
12.2
-0.002118
163.0
0.9943
0.32
Concentration
BORT
Accuracy
Precisio
2
98.4
19.8
5
93.2
19.5
10
93.9
8.9
20
108.2
13.1
50
104.0
10.1
100
98.2
5.8
250
99.5
3.9
Concentration
ERLO
Accuracy
Precis
50
91.8
13.
100
94.3
10.
200
113.9
7.1
500
109.0
5.7
1000
103.5
5.1
2000
101.4
4.4
3500
94.9
3.6
Concentration
NILO
Accuracy
Precisi
50
111.5
7.8
100
99.7
4.6
200
111.1
4.5
500
98.5
5.3
1000
93.0
7.0
2000
97.5
3.3
3500
103.2
3.0
used for BORT, DASA and SUNI while QCs
used for the other TKIs. A 0.5 mg/mL d8-
tion was prepared by dissolving 1 mg of the
alibration samples and three plasma quality
by adding the appropriate volume of each
olecular ion/product ion for quantification,
onfirmation and detection parameters (tube
r each analyte
, blank, calibration standards and QCs were
rocentrifuge tubes and mixed with 200
µ
l of
r automatic vortexing for 10 minutes, each
°
C for 15 minutes. Hundred microliters of
he mobile phases A and B in a 50/50 (v/v)
ials were transferred into the autosampler
-five microliters aliquots of the extract were
ltaneous quantification of commonly used
chromatography coupled with tandem MS.
ighest calibrator sample containing all are
n curve and lower limit of
atisfactory chromatographic profile and a
es over the entire ranges of concentrations
ar regression of the peak-area ratio of each
respective TKI in each standard sample.
This model was optimal for the 9 TKIs. Standard curves, prepared from different
biological plasmas (EDTA), were performed in plasma on twenty consecutive days.
The assay proved to be linear and acceptable, as the regression coefficients were
>0.99 for each of the twenty standard curves excepted for sorafenib (mean r
2
0.9894)
(Table 2).
A linearity test has been performed to compare theorical values, mean and standard
deviations of the back-calculated values to each nominal concentration used in the
low and the high standard curves. Then the accuracies were calculated for each
analyte. In all cases, slopes of these linear curves were ranging between 0.9987 to
1.019 and statistics showed slopes significantly different from 1 (p<0.0001). The
LLOQ was established at 2 ng/mL for BORT, DASA and SUNI and 50 ng/mL for the
others drugs in human plasma.
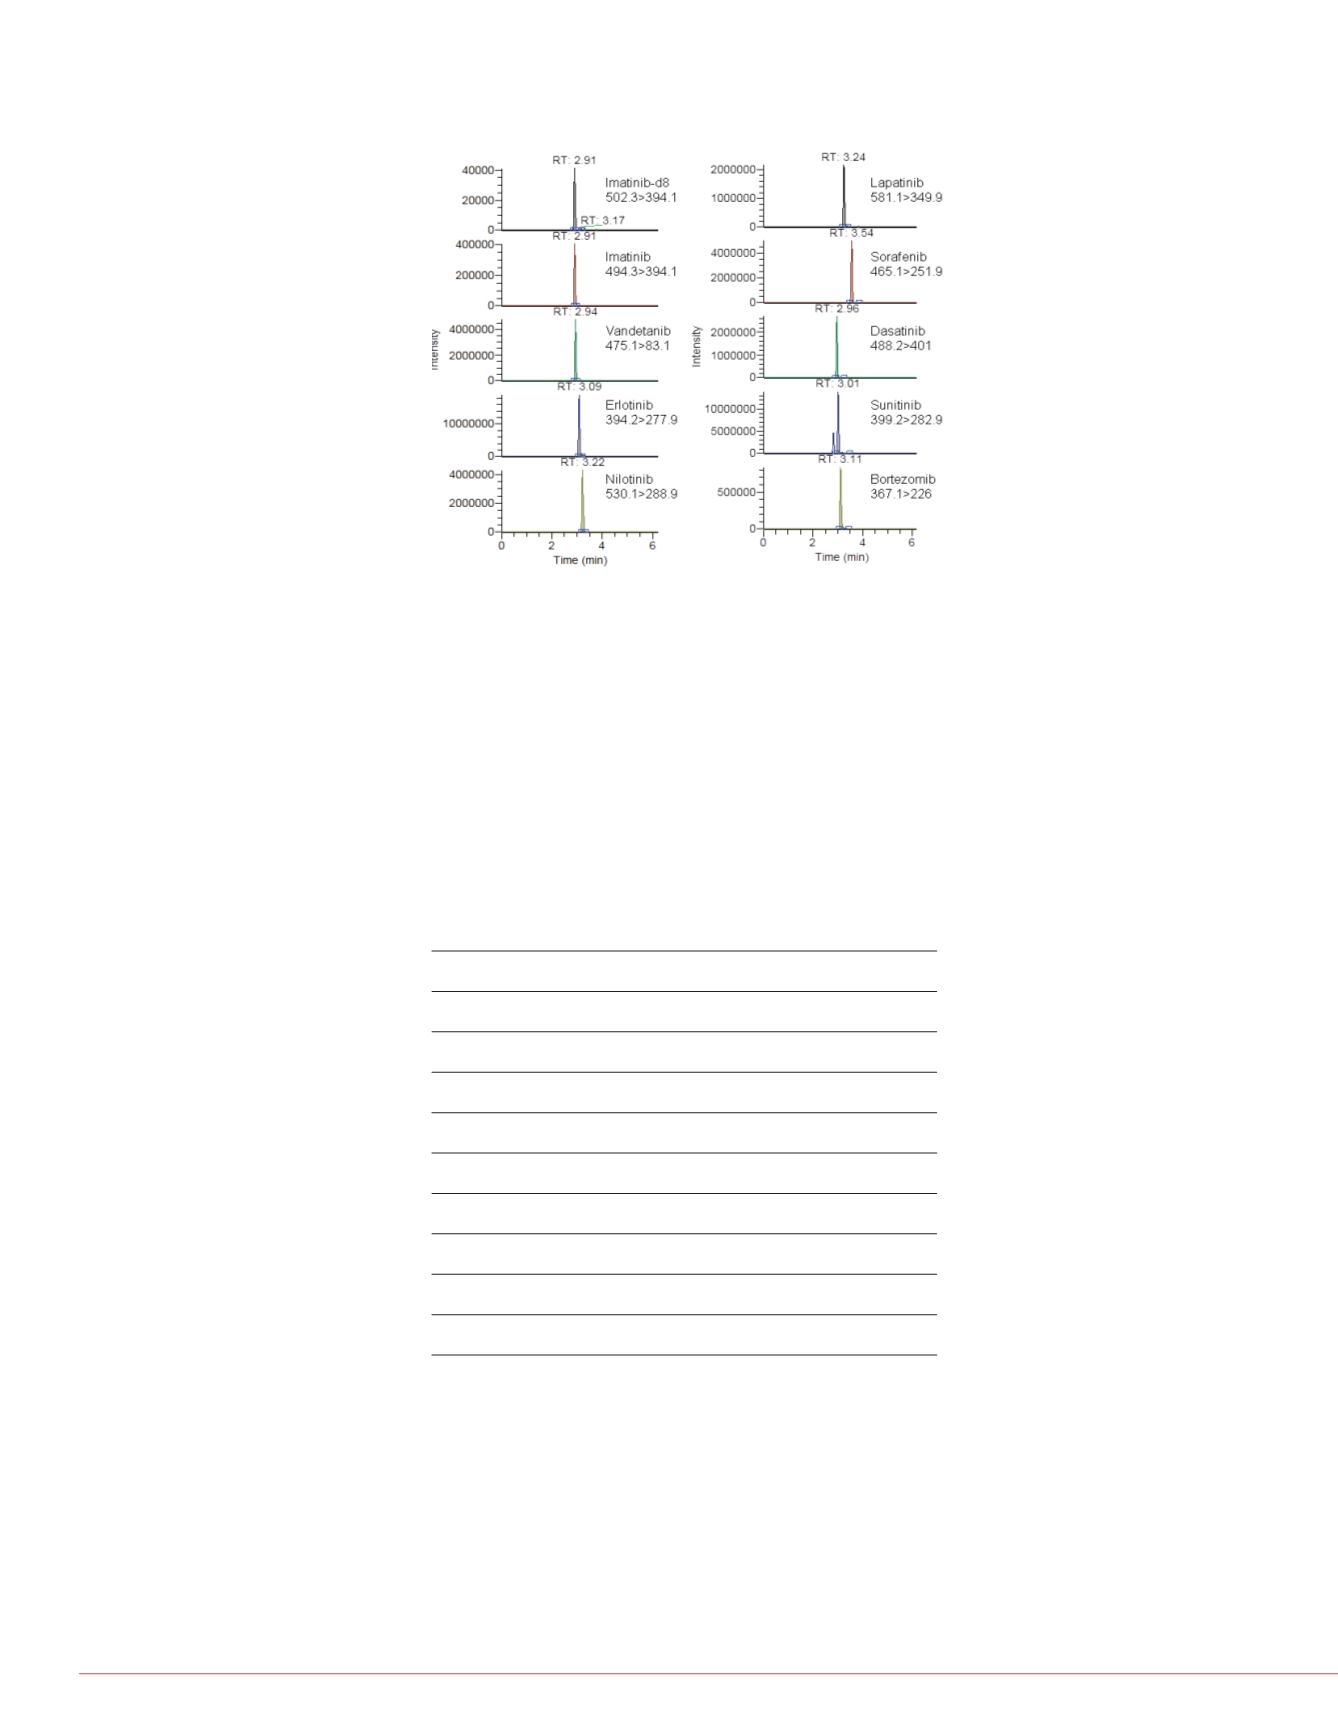
Fig. 1: Chromatogram of the highest calibrator sample containing each TKI.
Accuracy and precision
Precision and accuracy determined
3. The levels of control samples wer
of the two sets of calibration curves
range of concentrations found in pati
similar over the entire concentration
inter-day precision was good with
inter-assay
bias from the nominal
were contained between and 86.8
reproducible for all TKIs and standar
Table 2:
Data detailing the slopes, intercepts, coefficient correlations (
r
2
) for 9TKIs
(n=20).
Table 3:
Assay performance data of the low
calibration samples for ERLO, IMAT, LAPA, NI
Selectivity and specificity
No peaks from endogeneous compo
in any of the 10 blank plasma extr
blank plasma were always below 6.
BORT, DASA, SUNI and at 50 ng/m
plasma provided from polymedicate
signal at each LLOQ. There were n
mg/l of amikacin, 20 mg/l of gent
imipenem and cisplatin, 0.5 mg/l
voriconazole, posaconazole, itracon


