


 214 / 302

4
Routine, Targeted and Non-Targeted Analysis of Environmental Contaminants of Emerging Concern – Development and Validation of a UHPLC Orbitrap MS Method
Table 2 lists screening results
samples along with their occu
312 CEC database. Of the 48
bisphenol A was the only one
TABLE 1. Results of targeted compound analysis.
FIGURE 3
.
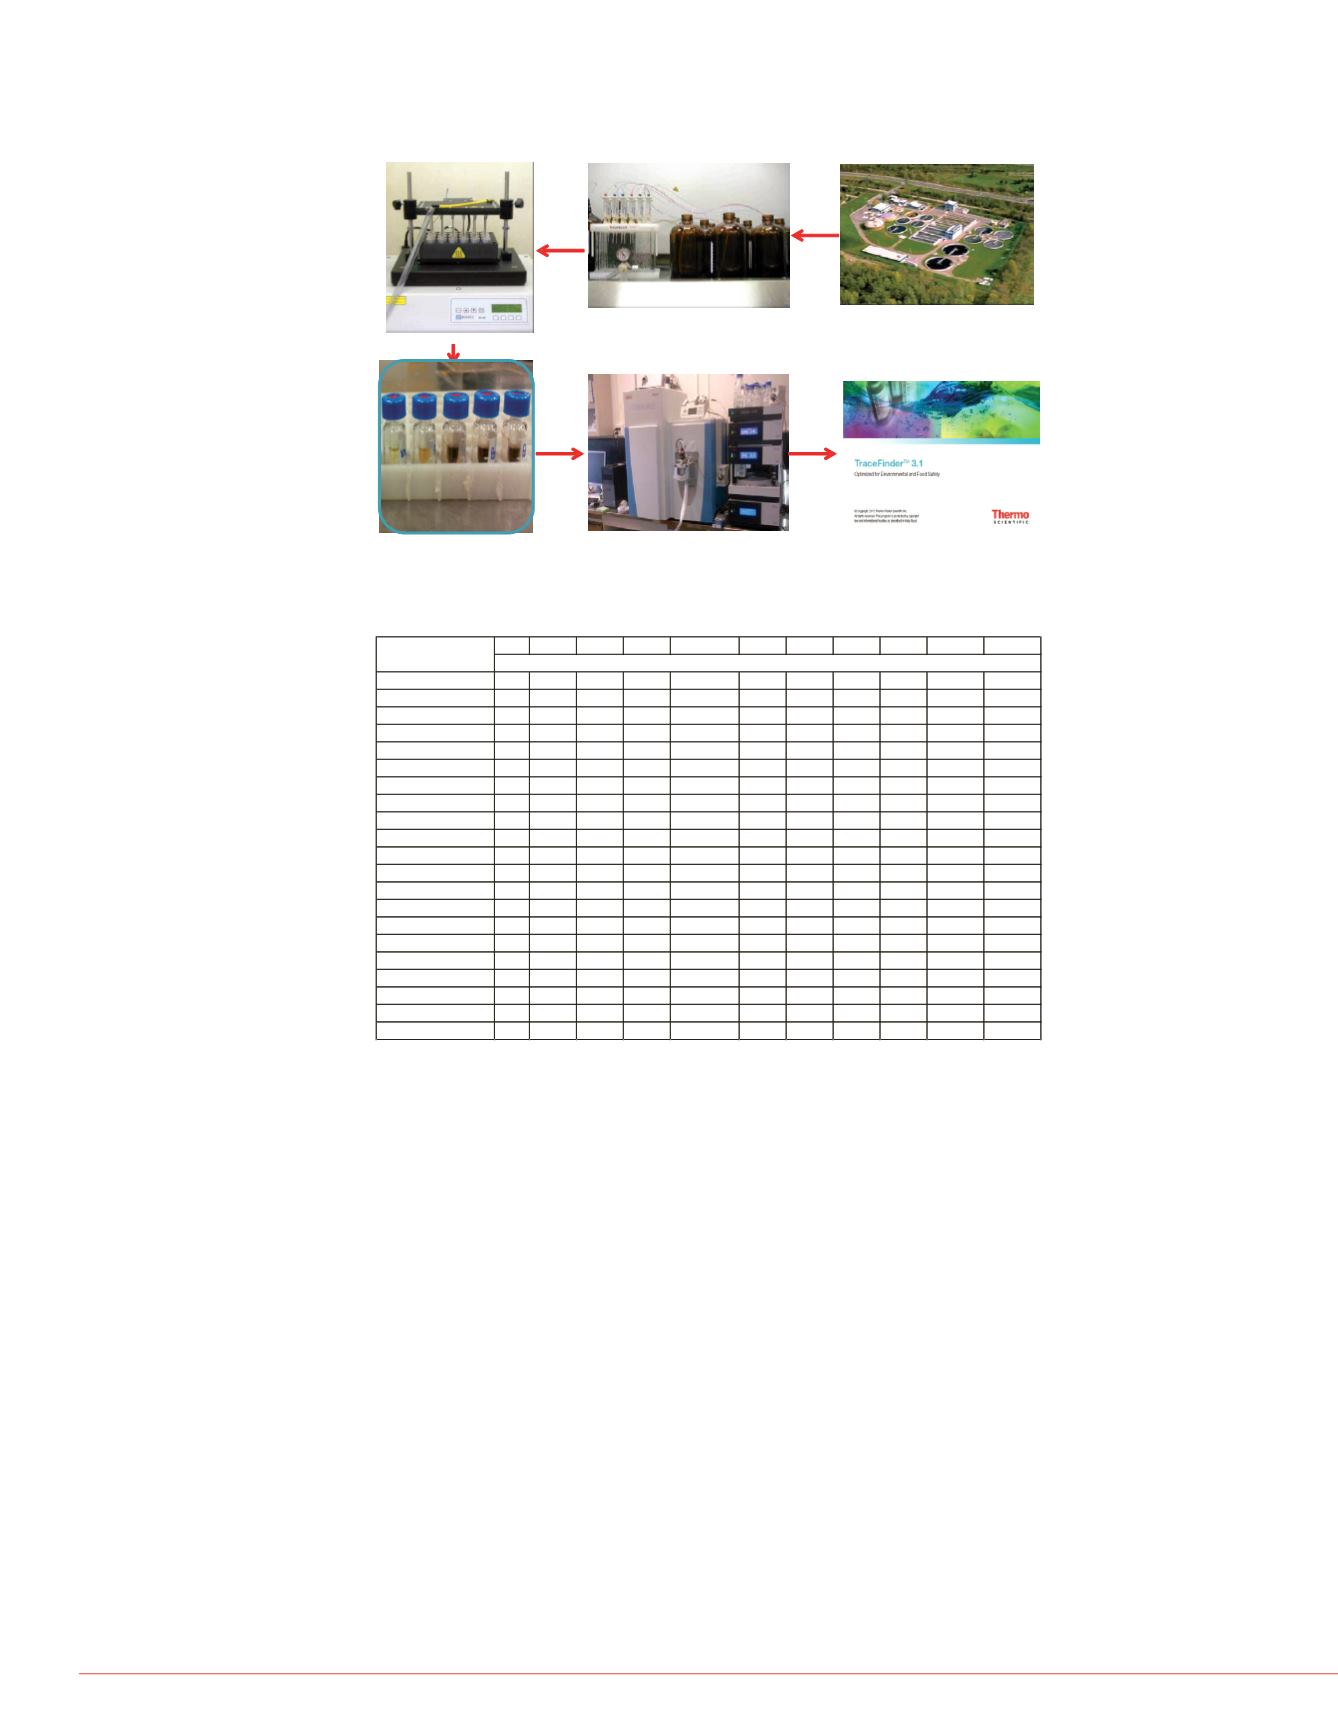
Sample preparation and analysis using UHPLC-Orbitrap MS.
rbitrap MS Analysis
(CH
3
OH) were purchased from Fisher
er used for aqueous mobile phases
g reverse osmosis water through a
ater purification system (Mississauga,
SB) method E3454
1
was used to
s and non-targeted compound
anada) HLB solid phase extraction
xtraction. Method E3454 has been
ratory Accreditation (CALA) since
purchased from Sigma-Aldrich
labelled standards were purchased
and Cambridge isotope Laboratories
led intermediate standard solutions
k solutions in CH
3
OH. Five levels of
iluting intermediate solutions with
entific™ Dionex™ UltiMate™ 3000
p, WPS-3000 autosampler, and a
made by injecting 5
µ
L extracts into
mode) and an Agilent XDB C-18,
ctively, for positive and negative mode
lysis is available on request (Ref. 1).
ic™ Exactive™ Plus Orbitrap MS
interface. The Orbitrap MS system
e modes by infusion of standard
itrogen (>99%) was used in the ESI
00 and 3,200 V for positive and
cquired at a resolving power of
eak width at
m/z
200, R
FWHM
),
n using automatic gain control target
ted, quantitative analysis of 61 CECs.
n-targeted screening along with a
ically active compounds, steroids,
. TraceFinder software is used to
+Na)
+
in the positive mode and (M-
ounds listed in the database. The
gram (XIC) using a mass extraction
tically identified using an XIC area
(ppt) depending on compound), a 5
(M) and an isotopic (M+1) peak
of < 10%. Typical screening time was
se. Analytical results were interpreted
nd exported to Microsoft Excel® with
entation.
S4
S6
ound analysis in the collected
ction limits (MDL). A total of 21 of the
les analyzed.
Screening of Non-targeted Compounds
The identification of non-targeted compounds uses accurate mass of the monoisotopic
peak M and isotopic (M+1) peaks, relative intensities of the M/(M+1) peaks and
isotopic pattern of the halogenated compounds. Manual inspection of line shape of the
XIC chromatogram, major fragment ions from the mass spectrum will also improve the
confidence and credibility of analytical results. Figure 4 shows examples of true
positive identification of 3-phenoxybenzoic acid, a common primary metabolite of the
synthetic pyrethroid insecticides (4A); a halogen containing xenobiotic 3,5-dibromo-4-
hydroxybenzoic acid (4B); and an artificial sweetener sucralose (Splenda®) (4C).
Figure 5 shows an example of false-positive identification of desethylatrazine, an
environmental metobolite of the pesticide atrazine. The mono-isotopic peak M has a
mass error of 0.2454 ppm and the XIC has a perfect Gaussian shape and can be
considered as a positive identification. However, mismatch of chlorine isotopic pattern
concludes that the compound in question is not desethylatrazine.
the three sampling locations.
MDL #1, PS #1, PS #2, PS #1, TWAS #1, PE #2, PE #2, SE #1, FE Permate Permate
Acetamidophenol
100 <MDL <MDL 578.5 111.5 1952.5 4026.5 <MDL <MDL 105.0 <MDL
Atenolol
50 <MDL <MDL <MDL <MDL 143.5 579.5 288.5 <MDL <MDL <MDL
Atorvastatin
10 147.5 3419.5 3417.5 107.5 <MDL 165.0 <MDL 3419.5 110.0 72.5
Bezafibrate
20 <MDL <MDL <MDL 49.0 53.0 109.0 23.0 <MDL <MDL <MDL
Caffeine
20 147.5 75.5 525.0 34.5 4426.5 <MDL 35.0 <MDL 288.0 105.5
Carbadox
200 <MDL <MDL <MDL <MDL <MDL <MDL <MDL <MDL <MDL <MDL
Carbamazepine 2 332.5 <MDL <MDL 107.0 24.0 235.5 115.0 <MDL 262.0 183.5
Ciprofloxacin
100 918.0 289.0 289.5 316.0 304.5 319.5 315.0 298.5 606.5 536.0
DEET
150 <MDL <MDL <MDL <MDL <MDL 338.5 <MDL <MDL <MDL <MDL
Diclofenac sodium 100 <MDL <MDL <MDL 166.5 <MDL 148.5 <MDL <MDL <MDL <MDL
Hydrocortisone 5 1781.5 <MDL <MDL 7.5
8.0 11.0 9.5 <MDL 976.5 636.5
Lidocaine
10 38.0 <MDL <MDL 114.0 <MDL 118.5 54.5 <MDL 32.5 35.5
Oxolinic Acid
20 <MDL <MDL <MDL 81.0 <MDL 125.5 49.0 <MDL <MDL <MDL
Progesterone
20 29.0 <MDL <MDL <MDL <MDL 957.5 <MDL <MDL 108.5 <MDL
Bisphenol A
200 4458.0 617.5 1252.5 522.0 1211.0 1675.5 213.0 249.0 3621.5 3383.5
Equilin
50 1619.0 449.5 <MDL <MDL 678.0 1531.0 1337.0 <MDL 1441.0 345.5
Estriol
200 <MDL 472.5 <MDL 1006.0 216.5 <MDL <MDL <MDL <MDL <MDL
Gemfibrozil
10 <MDL 121.5 193.0 281.0 174.0 125.0 77.5 127.0 260.0 227.0
Oxybenzone
50 158.5 346.0 <MDL 170.0 237.0 166.5 170.0 196.0 159.5 159.5
Triclocarban
50 <MDL 734.0 429.0 366.5 1176.5 532.0 247.5 411.0 <MDL <MDL
Triclosan
120 3068.5 <MDL <MDL 2422.0 <MDL <MDL <MDL 343.5 777.5 912.0
ng/L
Compound
FIGURE 4
.
Examples of true
FIGURE 5
.
Example of a fal
Reconstituted in 250 ul vial
insert using 100 ul H20
Filtered samples were extracted
at pH7 using Waters™ HLB SPE
cartridge
Grab sample collected in
1-L brown glass bottles
Extracts evaporated
to near dryness
UHPLC Orbitrap MS Analysis
Quantitative and non-targeted
analysis by TraceFinder software