


 213 / 302

3
Thermo Scienti c Poster Note
•
PN ASMS13_T589_Yang_E 07/13S
the targeted, quantitative
s) and non-targeted screening
amples. The method used a
rmance liquid chromatography
ass spectrometry analysis
ceFinder™ software tool. An in-
luding parents products and
ts was used in the verification of
of CECs. Samples collected
ess of this method for both
analytical standards.
are generally described as
cted or not routinely monitored,
ose a risk to human health and
recently available analytical
e process details. Due to limited
ware, software, analytical
focused on selected analytes
known chemical classes in the
analytical method that can be
2 non-targeted CECs. Analytical
sed to evaluate and
re 1) and two WWTPs (Figure
technologies. Following
rom the aerated grit tank
ludge tank (Figure 1, TWAS,
n after primary sedimentation
first point of addition of ferric
tion. Secondary and final
eate (Figure 1, S5) were also
collected and stored at 4
±
2 ºC
TABLE 1. Results of targeted co
FIGURE 3
.
Sample preparation a
the three locations of sampling
Chemicals, Sample Preparation and UHPLC Orbitrap MS Analysis
HPLC grade acetonitrile (CH
3
CN) and methanol (CH
3
OH) were purchased from Fisher
Scientific (Ottawa, ON, Canada). High purity water used for aqueous mobile phases
and sample preparation was produced by passing reverse osmosis water through a
Thermo Scientific™ Barnstead™ Nanopure™ water purification system (Mississauga,
ON, Canada). Laboratory Services NBranch (LaSB) method E3454
1
was used to
prepare samples for targeted compound analysis and non-targeted compound
screening. Waters OASIS® (Mississauga, ON, Canada) HLB solid phase extraction
(SPE) cartridge (6 cc, 500 mg) was used in the extraction. Method E3454 has been
accredited by the Canadian Association for Laboratory Accreditation (CALA) since
2004.
Neat standards of native target compounds were purchased from Sigma-Aldrich
(Oakville, ON, Canada). Deuterium (D) and
13
C-labelled standards were purchased
from CDN Isotopes (Pointe-Claire, QC, Canada) and Cambridge isotope Laboratories
(Andover, MA, US). Native and isotopically-labelled intermediate standard solutions
were prepared by mixing the corresponding stock solutions in CH
3
OH. Five levels of
analytical standard solutions were prepared by diluting intermediate solutions with
CH
3
OH.
Sample analysis was achieved on a Thermo Scientific™ Dionex™ UltiMate™ 3000
UHPLC consisting of a HRG-3400RS binary pump, WPS-3000 autosampler, and a
TCC-3400 column compartment. Separation was made by injecting 5
µ
L extracts into
a Thermo Scientific™ Betasil™ column (positive mode) and an Agilent XDB C-18,
2.1x100 mm coreshell technology column, respectively, for positive and negative mode
Orbitrap MS analysis. Details of the UHPLC analysis is available on request (Ref. 1).
The UHPLC was interfaced to a Thermo Scientific™ Exactive™ Plus Orbitrap MS
using a heated electrospray ionization (H-ESI II) interface. The Orbitrap MS system
was tuned and calibrated in positive and negative modes by infusion of standard
mixtures of MSCAL5 and MSCAL6. High purity nitrogen (>99%) was used in the ESI
source (35 L/min). Spray voltages used were 2,500 and 3,200 V for positive and
negative modes. Mass spectrometric data was acquired at a resolving power of
140,000 (defined as full-width-at-half-maximum peak width at
m/z
200, R
FWHM
),
resulting a scanning rate of > 1.5 scans/sec when using automatic gain control target
of 1.6x10
6
and a C-trap inject time of 50 msec.
Data Analysis
TraceFinder software was used to perform targeted, quantitative analysis of 61 CECs.
The same software was also used to perform non-targeted screening along with a
database of 312 CECs consisting of pharmaceutically active compounds, steroids,
hormones, surfactants and perfluorohydrocarbon. TraceFinder software is used to
search for adduct ions (M+H)
+
, (M+NH
4
)
+
and (M+Na)
+
in the positive mode and (M-
H)
−
molecular ion in the negative mode for compounds listed in the database. The
software then creates an extracted ion chromatogram (XIC) using a mass extraction
window (MEW) of 5 ppm. Analytes were automatically identified using an XIC area
threshold of 50,000 (approximately 25–50 pg/mL (ppt) depending on compound), a 5
ppm mass accuracy for the mono-isotopic mass (M) and an isotopic (M+1) peak
threshold of 90% with relative intensity variation of < 10%. Typical screening time was
about 65 sec/sample using the 312 CEC database. Analytical results were interpreted
manually for the top 10
th
percentile compounds and exported to Microsoft Excel® with
which analytical data were compiled for the presentation.
S5
S3
S4
S6
Results
Targeted Compound Analysis
Table 1 lists results obtained from targeted compound analysis in the collected
samples along with their respective method detection limits (MDL). A total of 21 of the
61 target compounds were found in the ten samples analyzed.
Screening of Non-targeted Comp
The identification of non-targeted c
peak M and isotopic (M+1) peaks, r
isotopic pattern of the halogenated
XIC chromatogram, major fragment
confidence and credibility of analyti
positive identification of 3-phenoxyb
synthetic pyrethroid insecticides (4
hydroxybenzoic acid (4B); and an a
Figure 5 shows an example of false
environmental metobolite of the pe
mass error of 0.2454 ppm and the
considered as a positive identificati
concludes that the compound in qu
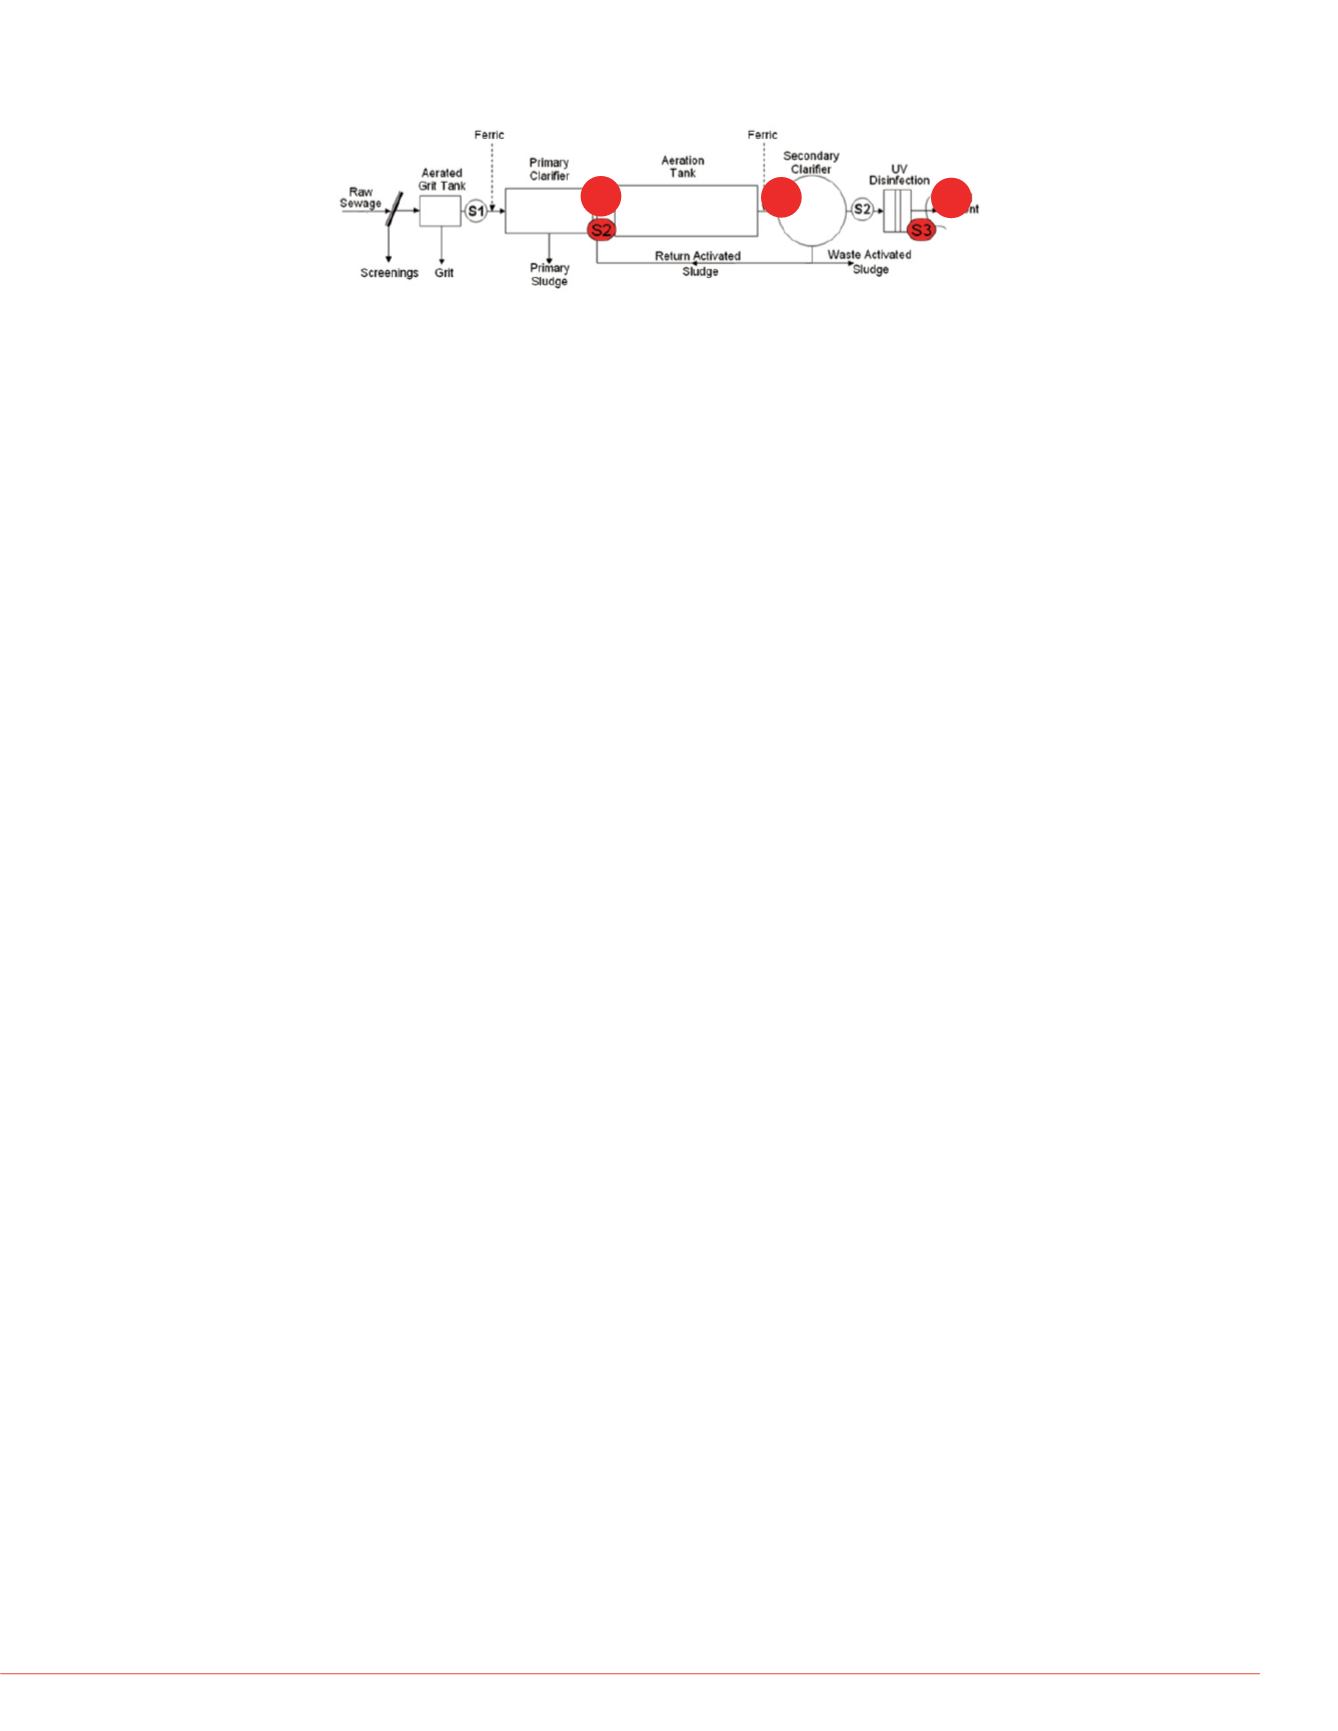
Figure 2. Schematic of the WWTP identifying the three sampling locations.
MDL #1, PS #1, PS #2,
Acetamidophenol
100 <MDL <MDL 57
Atenolol
50 <MDL <MDL <
Atorvastatin
10 147.5 3419.5 34
Bezafibrate
20 <MDL <MDL <
Caffeine
20 147.5 75.5 52
Carbadox
200 <MDL <MDL <
Carbamazepine 2 332.5 <MDL <
Ciprofloxacin
100 918.0 289.0 28
DEET
150 <MDL <MDL <
Diclofenac sodium 100 <MDL <MDL <
Hydrocortisone 5 1781.5 <MDL <
Lidocaine
10 38.0 <MDL <
Oxolinic Acid
20 <MDL <MDL <
Progesterone
20 29.0 <MDL <
Bisphenol A
200 4458.0 617.5 12
Equilin
50 1619.0 449.5 <
Estriol
200 <MDL 472.5 <
Gemfibrozil
10 <MDL 121.5 19
Oxybenzone
50 158.5 346.0 <
Triclocarban
50 <MDL 734.0 42
Triclosan
120 3068.5 <MDL <
Compound
Reconstituted in 250 ul vial
insert using 100 ul H20
Filtered s
at pH7 us
cartridge
Extracts evaporated
to near dryness
UHPLC