


 212 / 302

2
Routine, Targeted and Non-Targeted Analysis of Environmental Contaminants of Emerging Concern – Development and Validation of a UHPLC Orbitrap MS Method
Overview
The purpose of this work was to develop a method for the targeted, quantitative
analysis of 61 contaminants of emerging concern (CECs) and non-targeted screening
of 312 CECs in wastewater treatment plant (WWTP) samples. The method used a
solid phase extraction procedure (SPE), ultrahigh performance liquid chromatography
(UHPLC) separation, Thermo Scientific™ Orbitrap™ mass spectrometry analysis
(UHPLC-Orbitrap MS) and the Thermo Scientific™ TraceFinder™ software tool. An in-
house compound database consisting of 312 CECs including parents products and
their metabolites, conjugates and treatment by-products was used in the verification of
the workflow as well as the non-targeted identification of CECs. Samples collected
from WWTPs were used to demonstrate the effectiveness of this method for both
targeted and non-targeted CEC analysis without using analytical standards.
Introduction
Contaminants of emerging concern in the environment are generally described as
compounds that are unknown or unrecognized, undetected or not routinely monitored,
and represent a diverse group of chemicals that may pose a risk to human health and
the environment. New CECs were discovered by using recently available analytical
technologies and implicated by a prior knowledge of the process details. Due to limited
analytical capability and available resources (e.g., hardware, software, analytical
standards and capacity), monitoring of CECs has been focused on selected analytes
rather than a holistic approach which includes as many known chemical classes in the
analysis as possible. Presented in this poster is a new analytical method that can be
used in the quantitative analysis of 61 targeted and 312 non-targeted CECs. Analytical
results obtained for a series of WWTP samples were used to evaluate and
demonstrate the effectiveness of this method.
Methods
Sampling
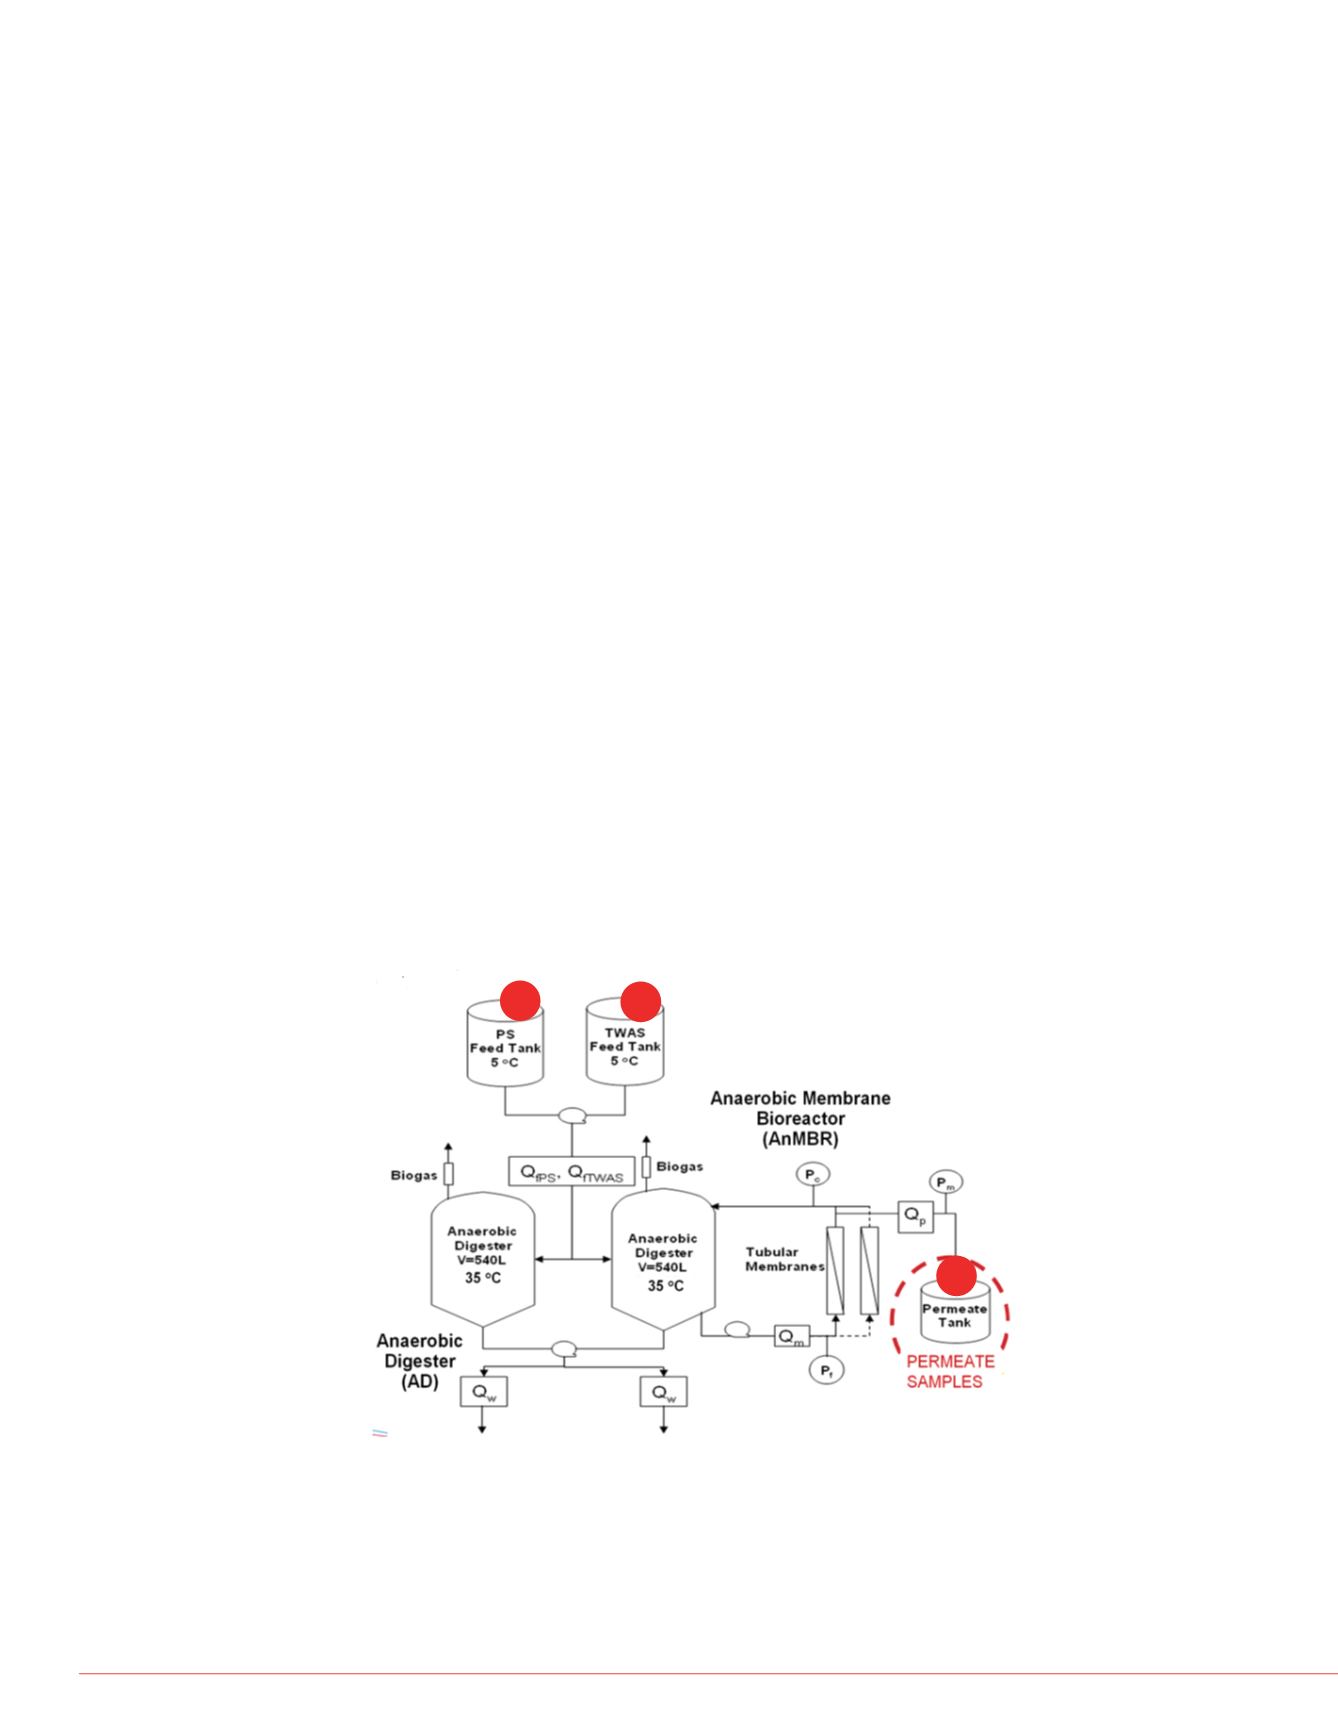
Grab samples were collected from a pilot WWTP (Figure 1) and two WWTPs (Figure
2) using a nitrifying process and ultraviolet disinfection technologies. Following
screening, primary sewage grab samples were taken from the aerated grit tank
(Figures 1 and 2, S1) and thickened waste activated sludge tank (Figure 1, TWAS,
S2). Primary effluent samples (Figure 2, S3) were taken after primary sedimentation
(with settled solids removed at this stage) and after the first point of addition of ferric
chloride to reduce total phosphorous through precipitation. Secondary and final
effluent grab samples (Figure 2, S4 and S6) and permeate (Figure 1, S5) were also
collected from the WWTPs. A total of ten samples were collected and stored at 4
±
2 ºC
until ready for analysis.
Figure 1. Schematic of the pilot WWTP identifying the three locations of sampling
points.
Chemicals, Sample Preparat
HPLC grade acetonitrile (CH
3
Scientific (Ottawa, ON, Canad
and sample preparation was p
Thermo Scientific™ Barnstea
ON, Canada). Laboratory Ser
prepare samples for targeted
screening. Waters OASIS® (
(SPE) cartridge (6 cc, 500 mg
accredited by the Canadian A
2004.
Neat standards of native targe
(Oakville, ON, Canada). Deut
from CDN Isotopes (Pointe-Cl
(Andover, MA, US). Native an
were prepared by mixing the c
analytical standard solutions
CH
3
OH.
Sample analysis was achieve
UHPLC consisting of a HRG-3
TCC-3400 column compartme
a Thermo Scientific™ Betasil
2.1x100 mm coreshell technol
Orbitrap MS analysis. Details
The UHPLC was interfaced to
using a heated electrospray io
was tuned and calibrated in p
mixtures of MSCAL5 and MS
source (35 L/min). Spray volta
negative modes. Mass spectr
140,000 (defined as full-width-
resulting a scanning rate of >
of 1.6x10
6
and a C-trap inject
Data Analysis
TraceFinder software was use
The same software was also
database of 312 CECs consist
hormones, surfactants and pe
search for adduct ions (M+H)
+
H)
−
molecular ion in the negati
software then creates an extra
window (MEW) of 5 ppm. Anal
threshold of 50,000 (approxim
ppm mass accuracy for the m
threshold of 90% with relative
about 65 sec/sample using th
manually for the top 10
th
perc
which analytical data were co
S1
S2
S5
Results
Targeted Compound Analysi
Table 1 lists results obtained fr
samples along with their respe
61 target compounds were fou
Figure 2. Schematic of the